
|
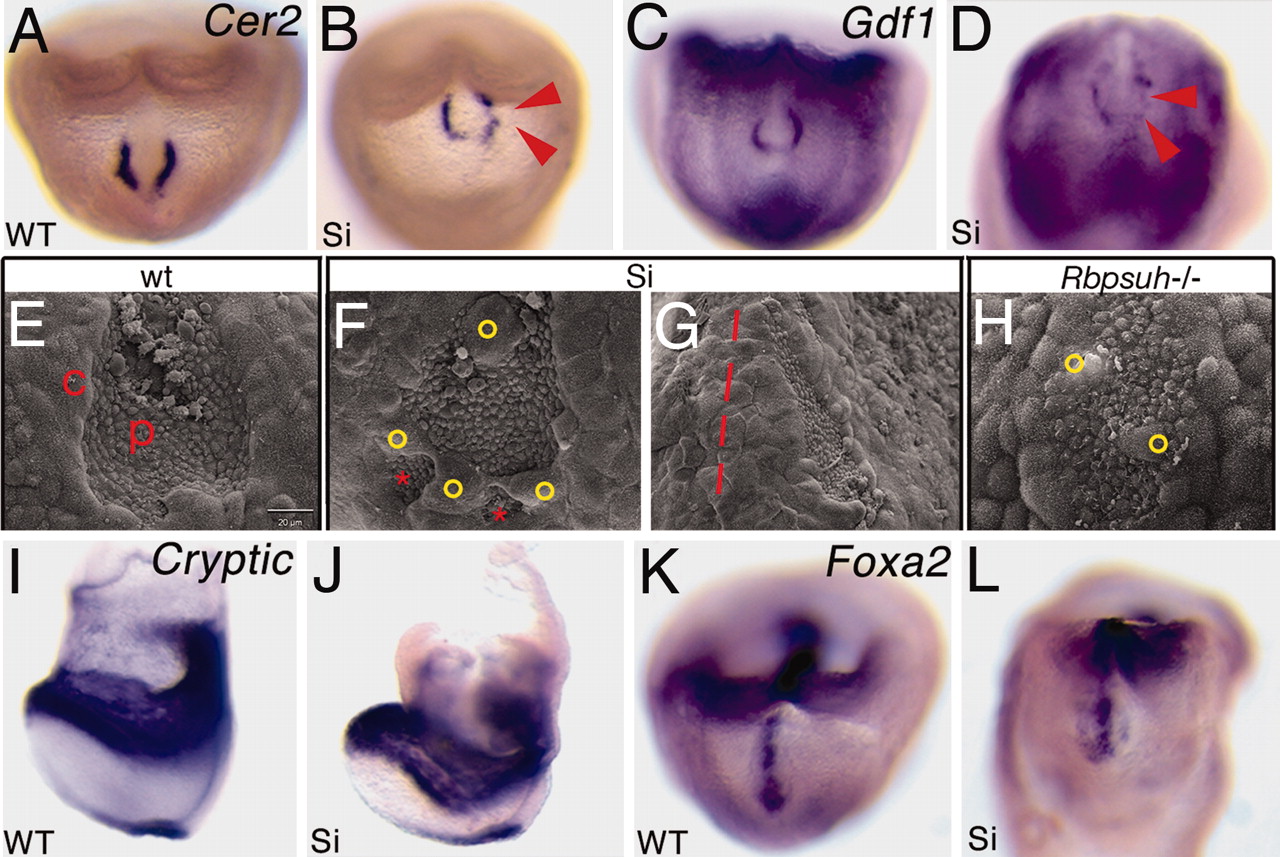
Fig. 2
Abnormal node morphology in Smarcd3 knockdown embryos. (A–D) Expression of Cer2 and Gdf1 in wild-type and Smarcd3 knockdown (Si) embryos. Red arrowheads show decreased or missing expression. (E–K) Scanning electron microscopy shows high magnification of the node in wild type (E), abnormal node morphology in Smarcd3 knockdown (F and G), and Rbpsuh -/- (H) embryos at E7.75. c, crown cells; p, pit cells. Smarcd3 knockdown results in abnormal node morphology, with separated pit cells (F, red asterisks) and abnormally migrated crown cells (yellow circles). Some Smarcd3 mutants also have abnormal leftward shifted nodes in addition (G, red line shows embryonic midline). Abnormal crown cells were seen in Rbpsuh -/- embryos (H, yellow circles). (I–L) Expression of Cryptic and Foxa2 in wild-type and Smarcd3 knockdown (Si) embryos.