Fig. 4
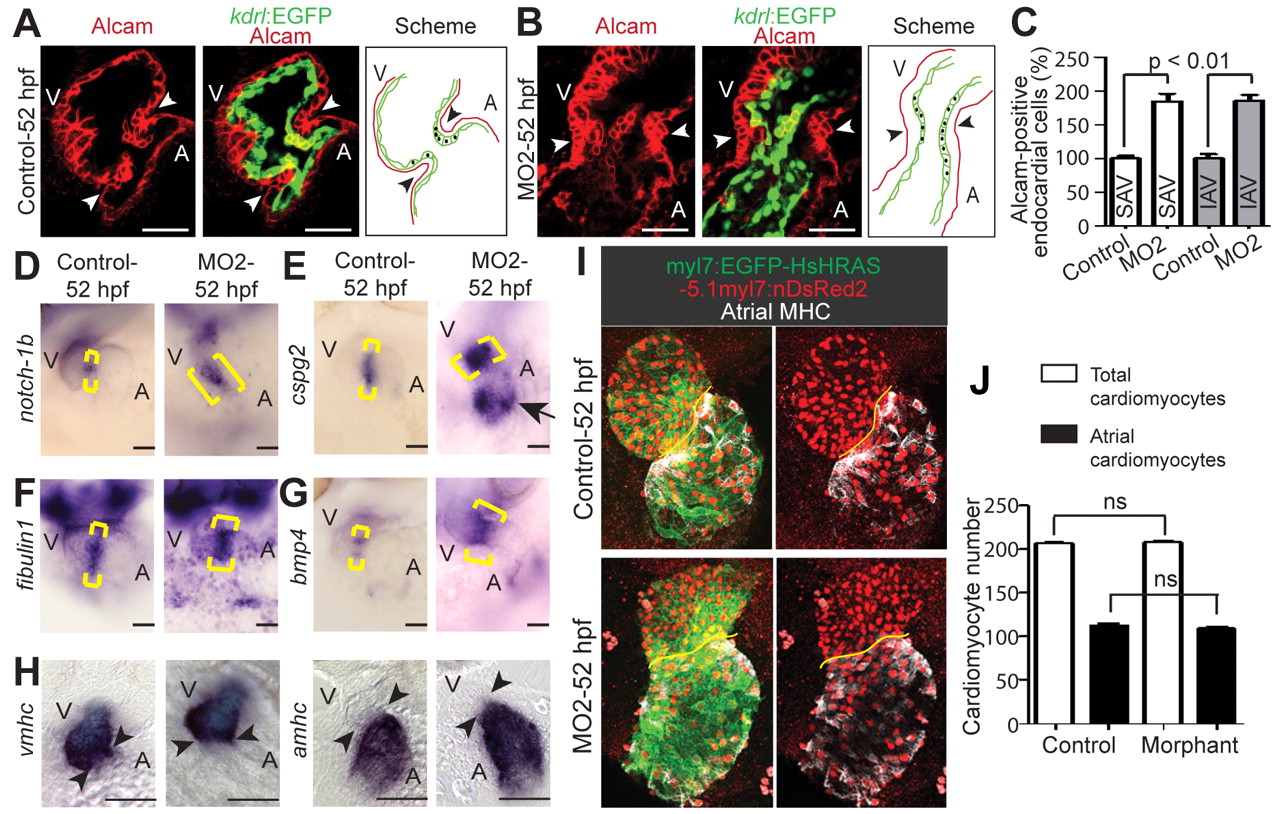
Fig. 4 Characterization of the extended AV canal. (A,B) Confocal sections of whole-mount Alcam-stained (red, indicating myocardium and differentiated endocardial cells) control (A) and MO2-injected (B) embryos from transgenic Tg(kdrl:EGFP)s843 zebrafish at 52 hpf. Npnt depletion caused an increase in differentiated endocardial cells (cuboidal in shape, Alcam positive and EGFP positive) at the AV boundary. Arrowheads indicate the AV boundary; red line, myocardium; green, endocardial cells; black dots, Alcam-positive endocardial cells. (C) Quantitative analysis of Alcam-positive endocardial cells (mean ± s.e.m.). SAV, superior AV; IAV, inferior AV. (D-G) Sections of 52 hpf control and MO2-injected embryos after whole-mount in situ hybridization for notch1b (D), cspg2 (E), fibulin 1 (F) and bmp4 (G). Expression of these genes was expanded in npnt morphants (brackets). (H) In situ hybridization with probes against the chamber-specific marker genes amhc and vmhc. (I) Projections of confocal images of hearts from whole-mount control and MO2-injected embryos from double-transgenic [Tg(–5.1myl7:nDsRed2)f2 × Tg(myl7:EGFP-HsHRAS)s883] zebrafish stained for atrial myosin heavy chain (MHC, white) and DsRed (red). Yellow line, AV junction. (J) Quantitative analysis of total (chambers + AV boundary) and atrial cardiomyocyte number (mean ± s.e.m.). ns, not significant. A, atrium; V, ventricle. Scale bars: 50 μm.

