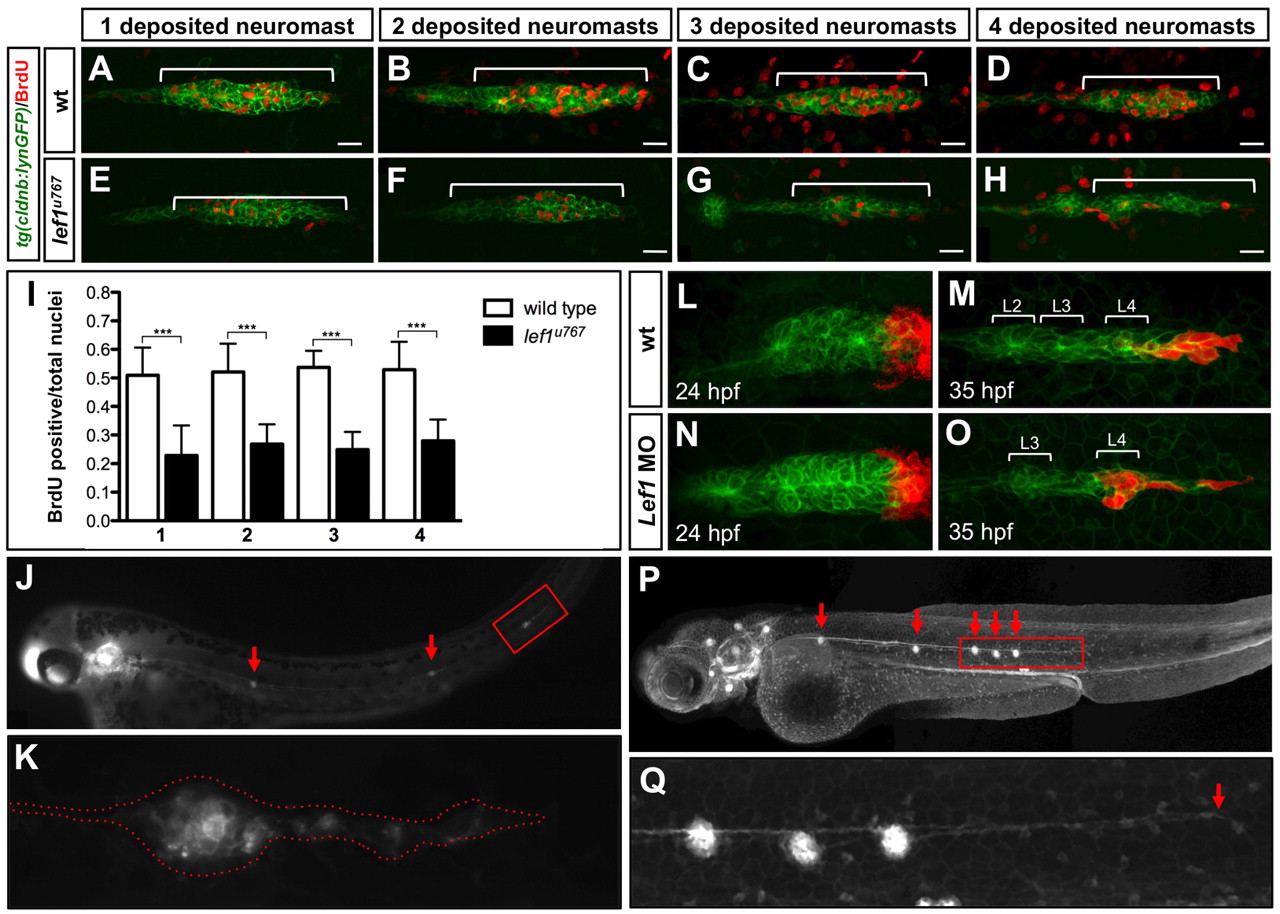
Fig. 5 Mutant PLL primordia collapse is due to decreased proliferation and depletion of leading zone cells. (A-H) Cell proliferation analysis in wild-type (A-D) and lef1u767 mutant (E-H) Tg(-8.0cldnb:lynEGFP)zf106 embryos. After BrdU pulse and chase, embryos were fixed after deposition of neuromast L1 (A,E), L2 (B,F), L3 (C,G) and L4 (D,H). Brackets show the primordium. Scale bars: 20 μm. (I) BrdU-positive cells/total cell ratio in wild type (white bars) and lef1u767 mutants (red bars) after one to four deposited neuromasts. Total cells where counted after DAPI staining nuclei. Significance was tested with Wilcoxon rank-sum test (***P<0.001). Data are mean+s.d. (J,K) 48 hpf aphidicolin/hydroxyurea-treated Tg(cldnb:lynGFP)zf106 embryos show three or four widely spaced neuromasts and a caudally extended row of cells (J). Red arrows indicate neuromasts. (K) Amplification of red rectangle in J. (L-O) Kaede photoconverted leading edge cells at 24 hpf in wild type (L) and lef1u767 (N) assessed at 35 hpf (M,O). Brackets indicate preformed neuromasts. (P,Q) Ablation of the caudal third of PLLP at 24 hpf leads to a lef1u767-like phenotype with 20%, 33.3% and 46.6% of the embryos displaying 3, 5 and 7 neuromasts respectively at 72 hpf (15 ablated specimens). Red arrows indicate neuromasts. (Q) Inset from P with red arrow showing the remaining migrating cells.
Image
Figure Caption
Figure Data
Acknowledgments
This image is the copyrighted work of the attributed author or publisher, and
ZFIN has permission only to display this image to its users.
Additional permissions should be obtained from the applicable author or publisher of the image.
Full text @ Development

