
|
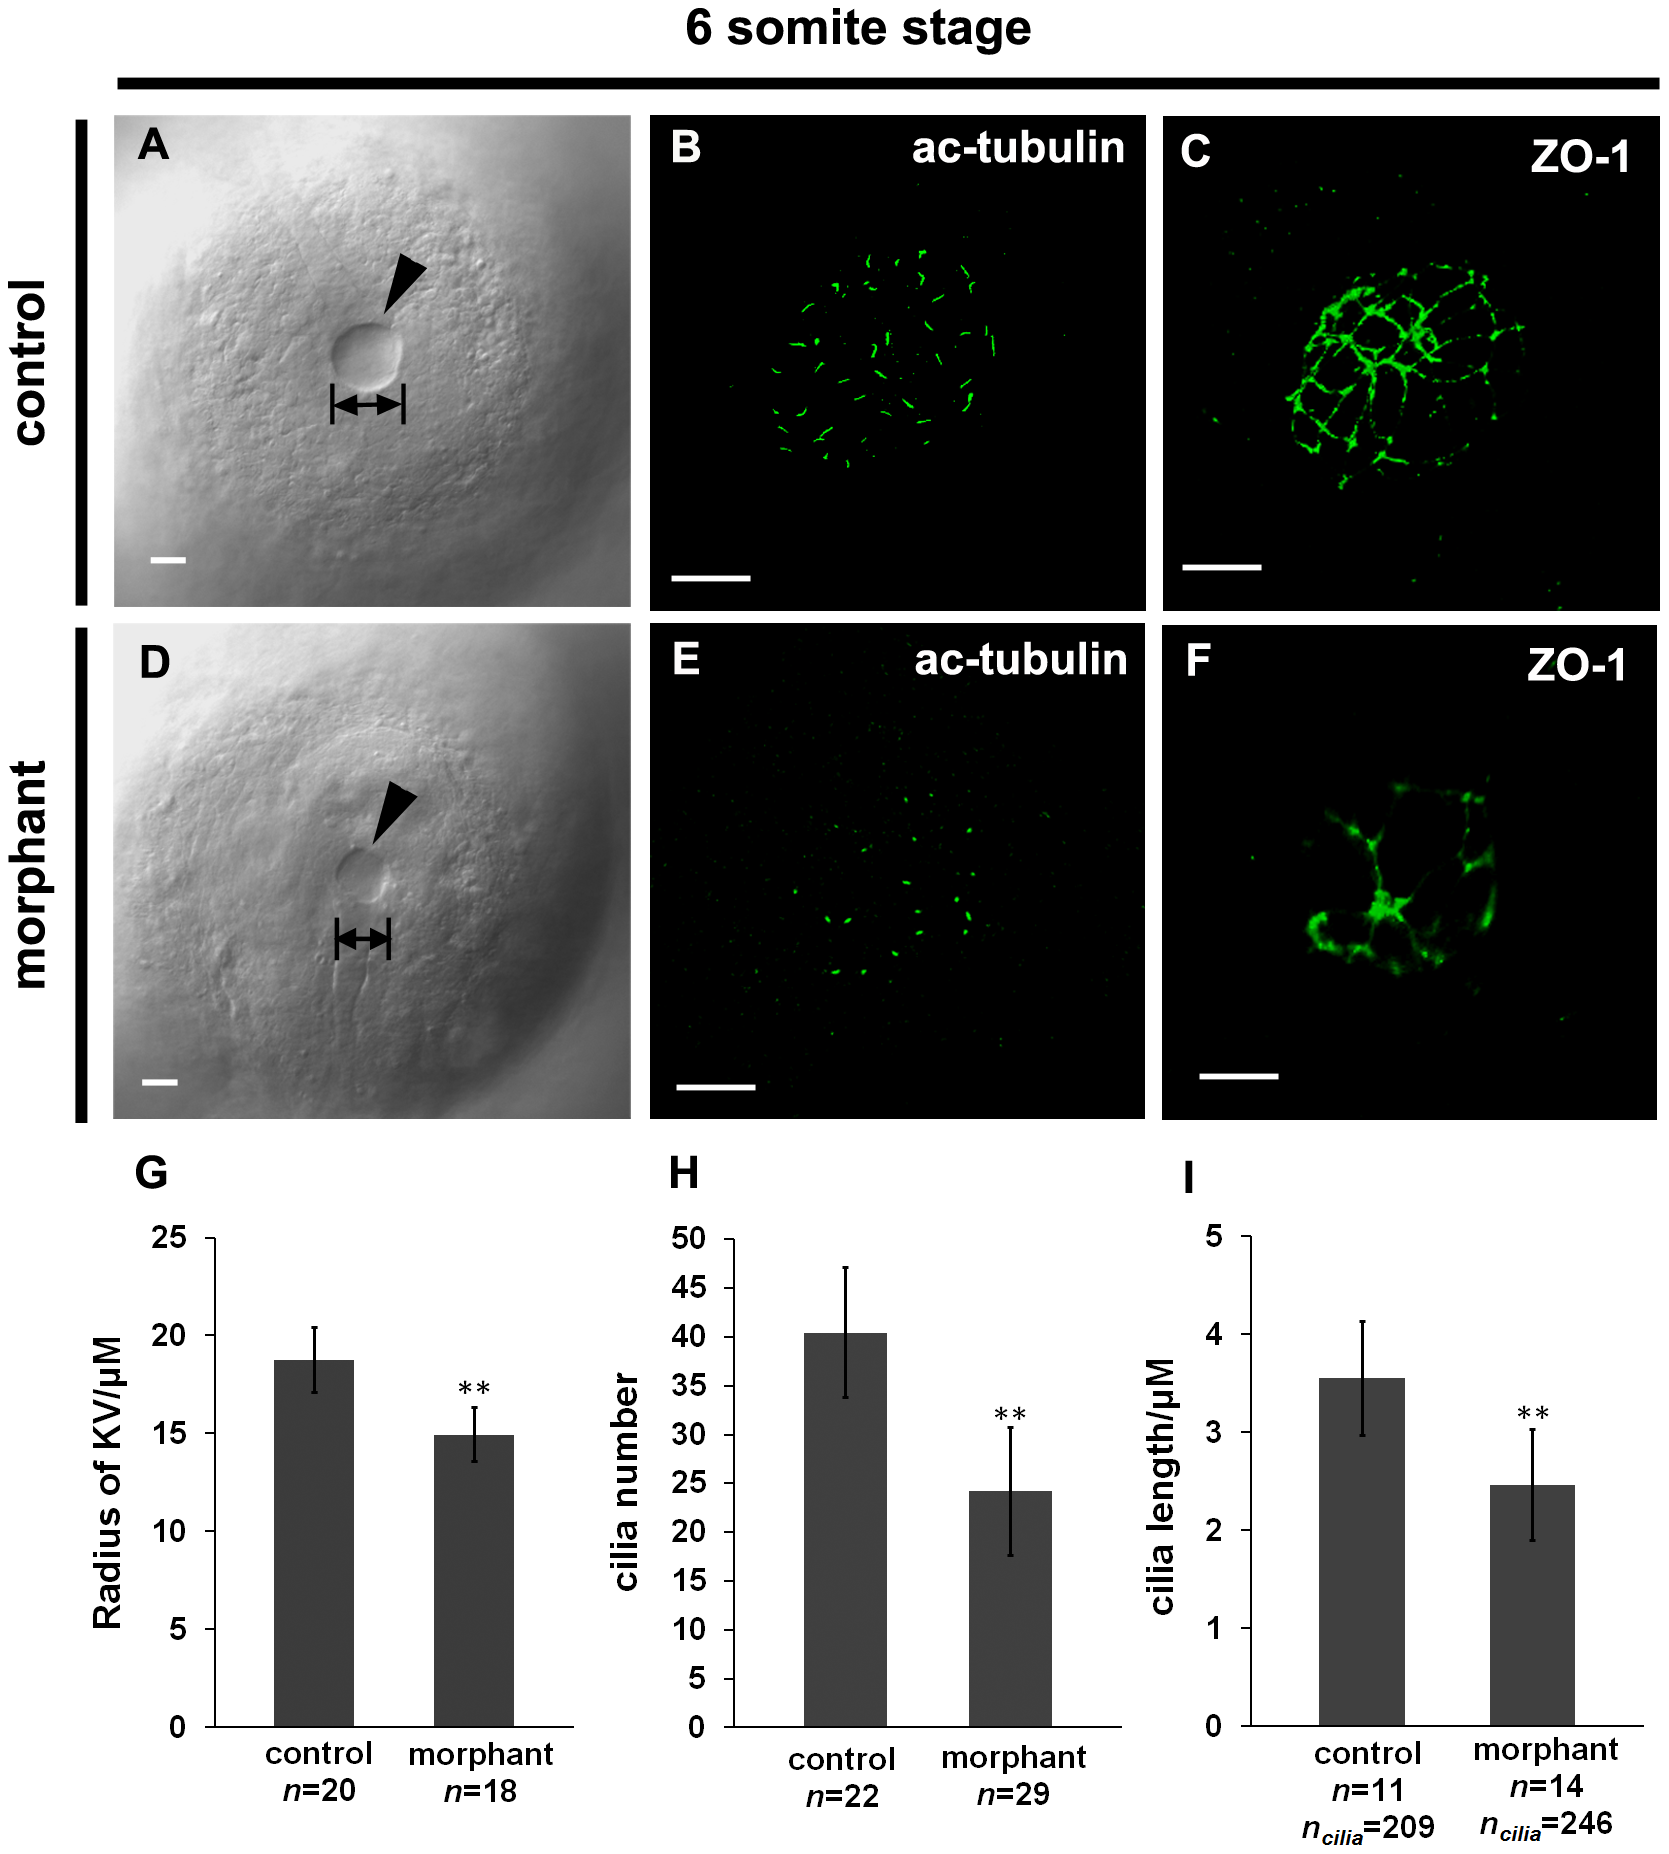
Fig. 4
KV formation is disturbed in wdr18 morphant embryos.
(A, D) DIC images of KV in control (A) and wdr18 morphant (D) embryos. Note the KV size in control was larger than that in the morphants. (B, E) Confocal images of cilia inside KV in control (B) and morphant (E) embryos detected by a fluorescent anti-acetylated tubulin antibody. Shown is a 3D projection of multiple focal slices spanning KV at an interval of 0.4 µm. (C, F) anti-ZO-1 staining of the KV in 6- to 8-somite stage embryos. The control embryo (C) developed a KV with a large fluid-filled lumen, showing a uniform ZO-1-positive tight junction lattice within the lining of the KV, while the wdr18 morphant embryo (F) showed a dysmorphic lattice of ZO-1 labeling within the KV. (G) Measurement of the radius of individual KV in control and morphant embryos at 6- to 8-somite stage and statistical analyses. (H) Graphic representation of quantification results of cilia number per KV in both control and morphant embryos at 6- to 8-somite stage. (I) Quantification result of cilia length in control and wdr18 morphant embryos at 6- to 8-somite stage. The double asterisks in G, H and I indicate that the difference is extremely significant between experimental and control samples (P<0.0001, Student′s t-test). Scale bars: 20 µm in A and D; 15 µm in B, C, E and F.