Fig. 3
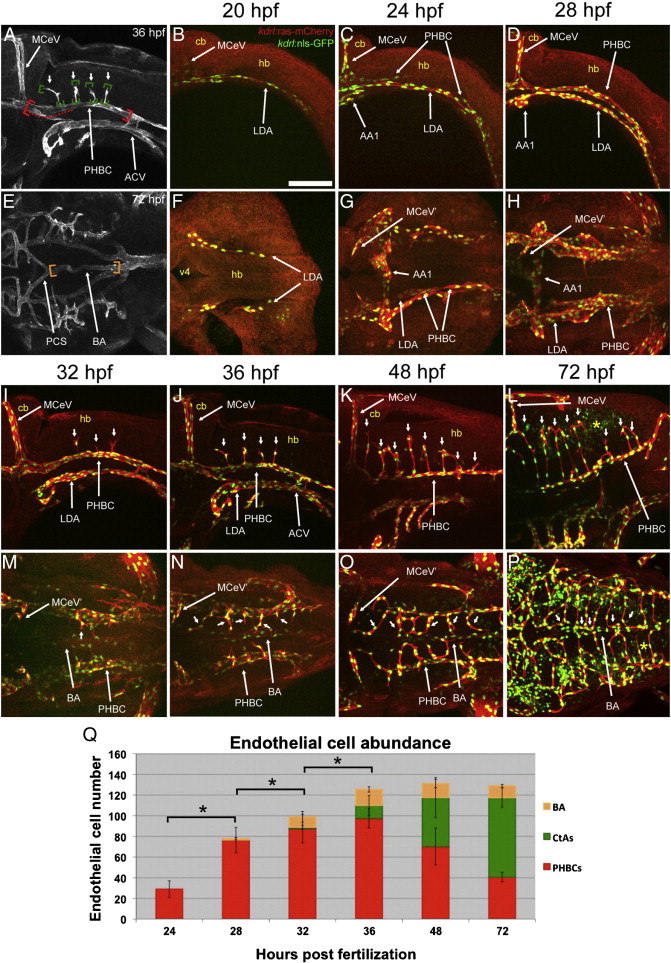
Endothelial cell abundance in the hindbrain vasculature (PHBC and its derivatives) increases and then stabilizes during development. A-P, Maximum intensity confocal projections of immuno-fluorescently stained embryos carrying the endothelial reporters Tg(kdrl:ras-mCherry)s896 and Tg(kdrl:nls-GFP). Endothelium, red. Endothelial cell nuclei, green. Ages (hpf) indicated above (except for A and E, where they are inside each picture at the top right corner). Abbreviations (see Table 1): vasculature, white; neuroepithelium, yellow. Small white arrows, CtAs. A-D, I-L, Left lateral views. Anterior, left. Dorsal, up. E-H, M-P, Dorsal views. Anterior, left. Left side, bottom. A, E, Diagrams showing the vascular regions where endothelial cell abundance was scored: PHBCs (delimited by the red brackets and dotted line, only the left one is shown in (A)), BA (orange brackets) and CtAs (green brackets). L,P, Neuroepithelial expression of the Tg(kdrl:nls-GFP) reporter after 48 hpf (yellow asterisk). These cells were not scored. Scale bar (B), 100 μm. Q, Bar graph showing endothelial cell abundance at 24–72 hpf in the PHBCs (red), BA (yellow) and CtAs (green). Consecutive stages with statistically significant differences (p < 0.05) in total endothelial cell abundance are indicated with a bracket and an asterisk.
Reprinted from Developmental Biology, 357(1), Ulrich, F., Ma, L.H., Baker, R.G., and Torres-Vazquez, J., Neurovascular development in the embryonic zebrafish hindbrain, 134-51, Copyright (2011) with permission from Elsevier. Full text @ Dev. Biol.

