
|
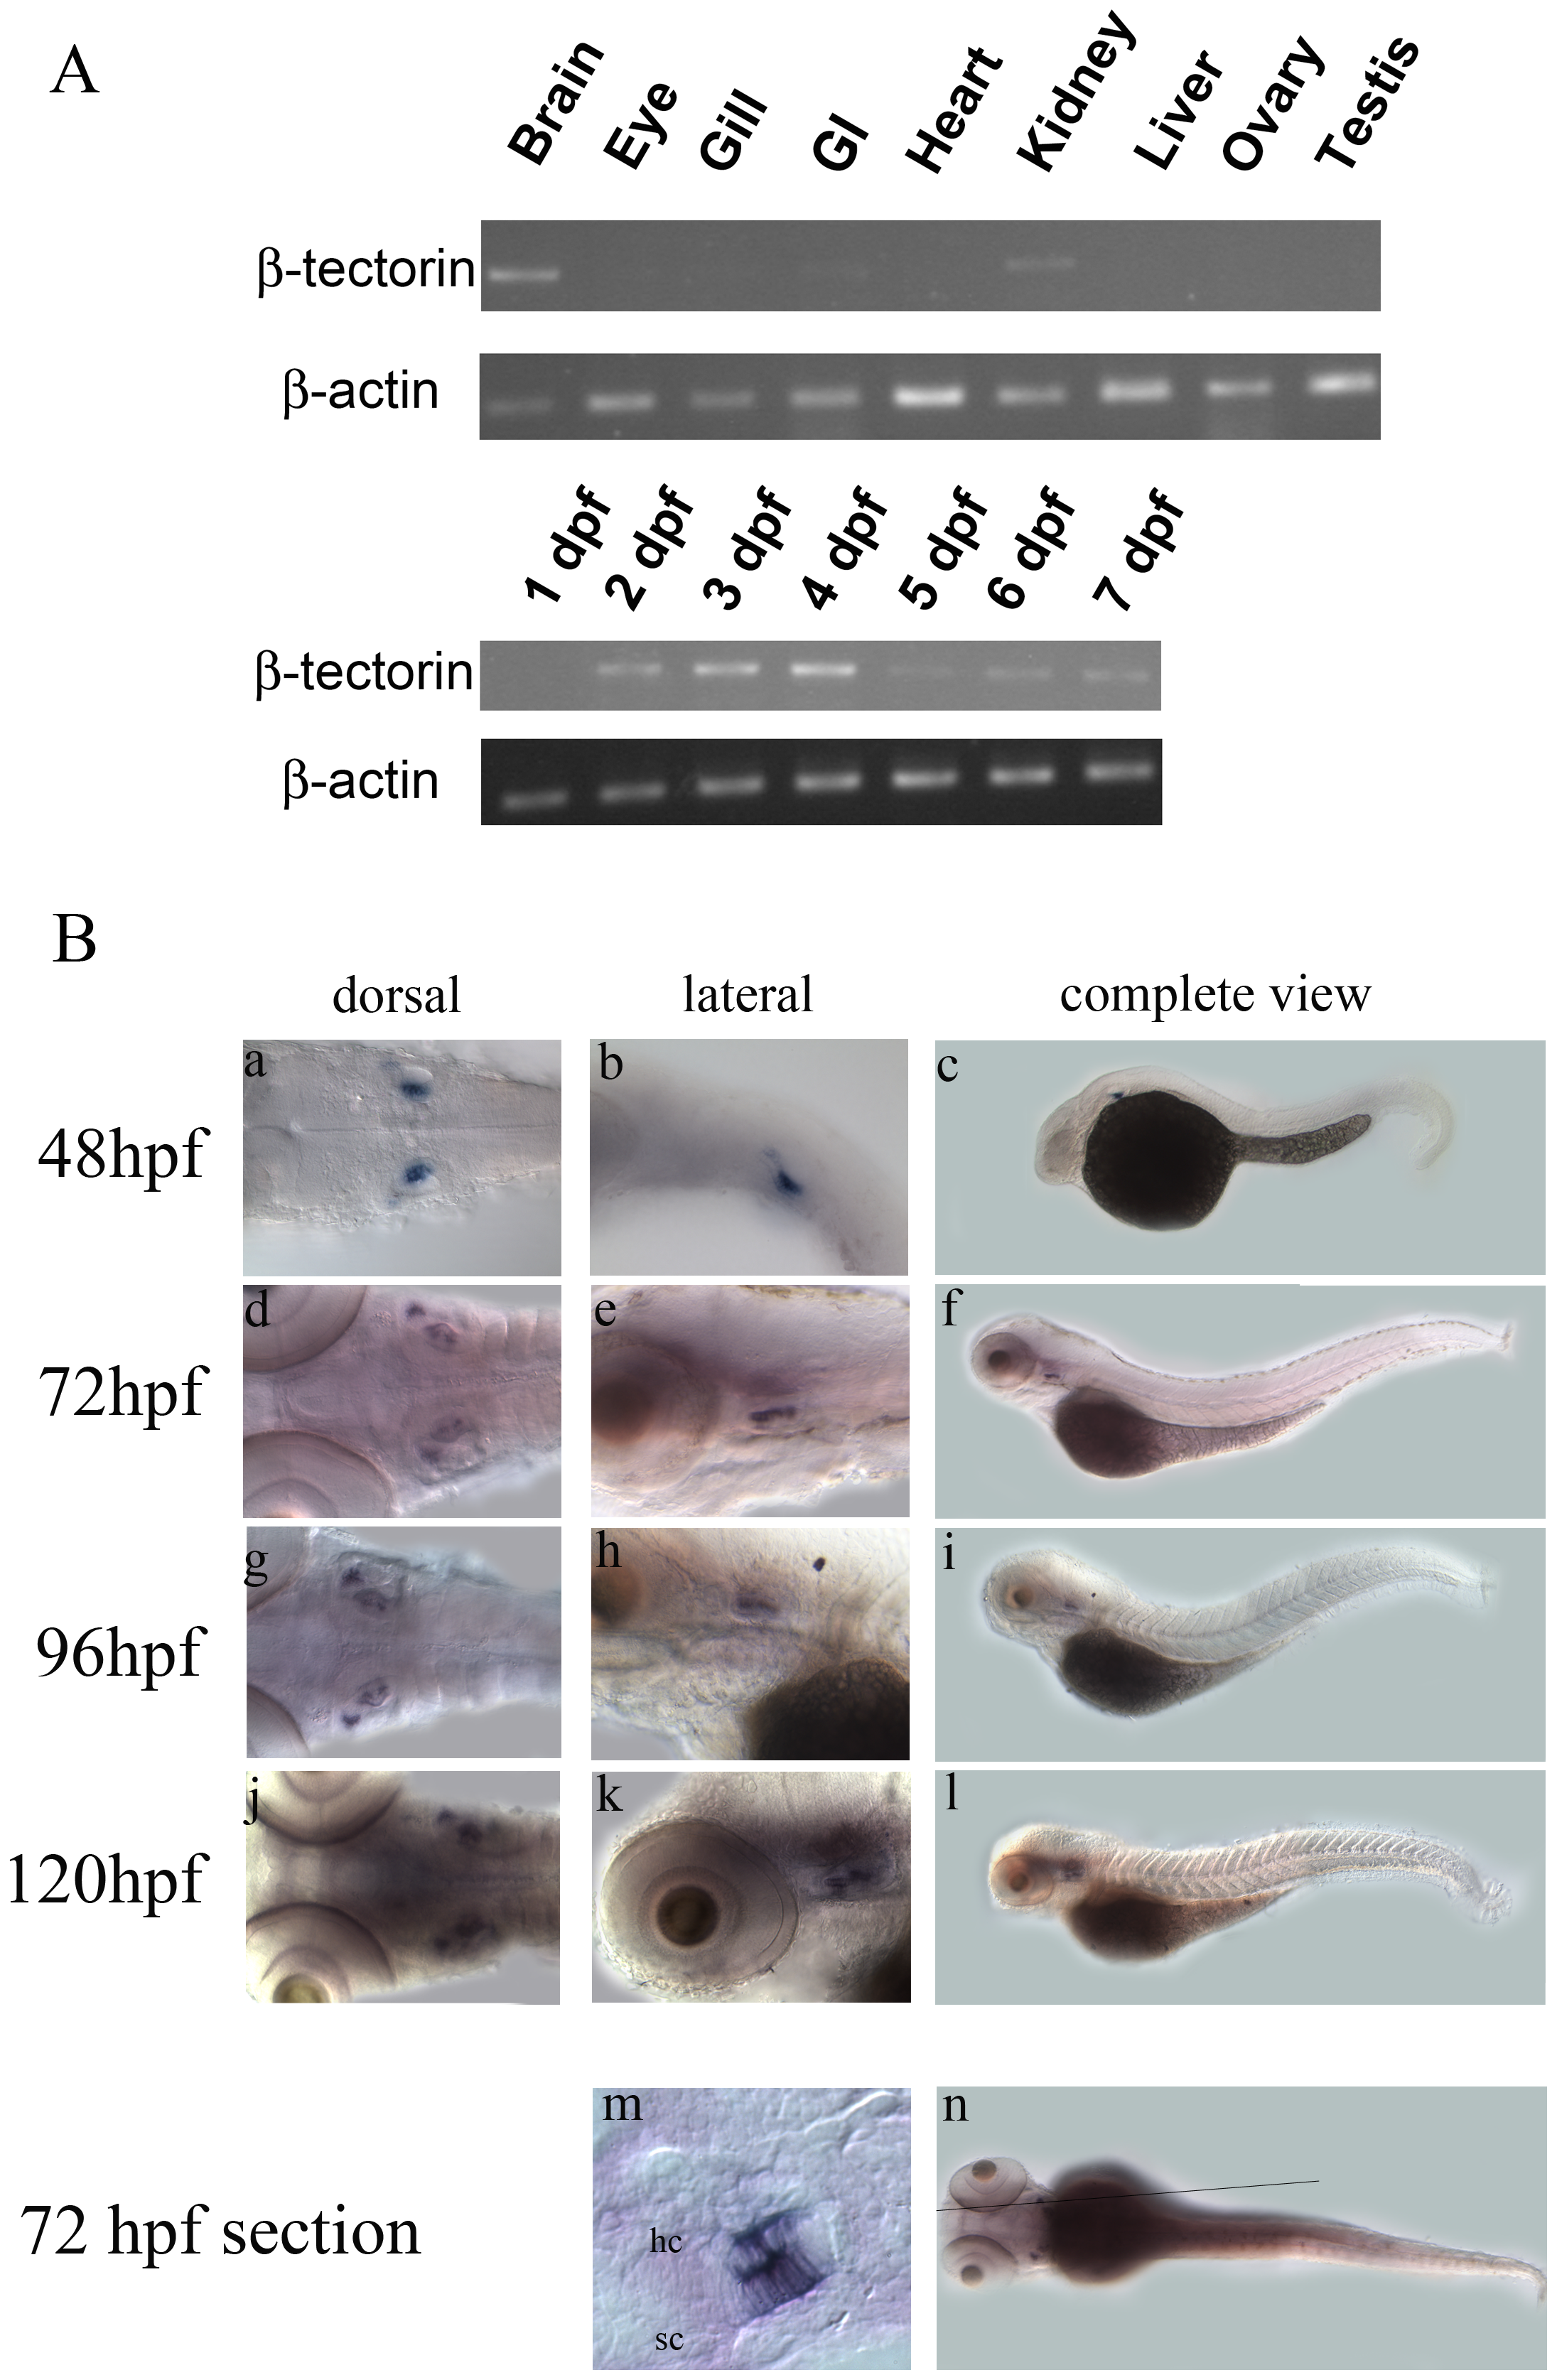
Fig. 3
Expression profiles of zebrafish β-tectorin mRNAs by RT-PCR and whole-mount in situ hybridization.
(A) RT-PCR of the β-tectorin transcript was performed using a pair of primers to produce a DNA fragment of 1208 bp. β-Actin bands were also used to normalize the amount of cDNA prepared from different tissues and embryos at different developmental stages. (B) Whole-mount in situ hybridization with antisense β-tectorin at different developmental stages was performed. The images were taken from the dorsal (a, d, g, j) and the lateral view (b, e, h, k), and complete lateral view (c, f, i, l) with the anterior to the left and dorsal to the top. Longitudinal sections of the embryo were at 72 hpf with anterior to the left and dorsal to the top (panel m). The straight line in panel n represents the region of sections in panel m. hc, hair cell; sc, supporting cell.