Fig. 7
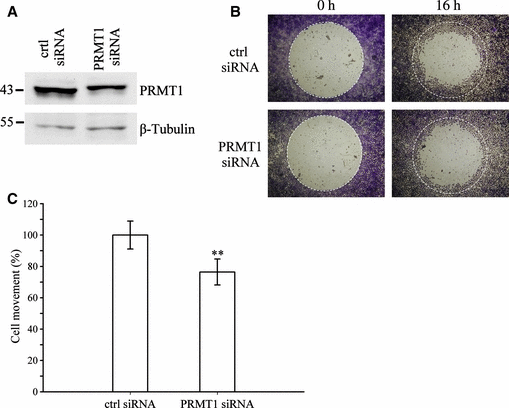
Reduced cell migration in a prmt1-deficient cell model. Huh7 cells were treated with control or prmt1 siRNA. (A) Cell extracts from the siRNA-treated cells were immunoblotted with anti-PRMT1. Detection by anti-β-tubulin was used as a loading control. Reduced PRMT1 protein expression by siRNA was normalized with the β-tubulin signal. (B) Images of the pre-migration and post-migration cells stained with crystal violet are shown. The white circles indicate areas covered by the stoppers before cell migration. (C) Quantification of cell movement is represented as the percentage of the area covered by migrated cells in prmt1 siRNA-treated cells compared to that in control cells. Data are shown as the mean ± SD of two independent experiments performed in quadruplicate. A statistically significant difference between the two siRNA-treated cells is indicated (**P < 0.01; Student’s t-test).

