Fig. 8
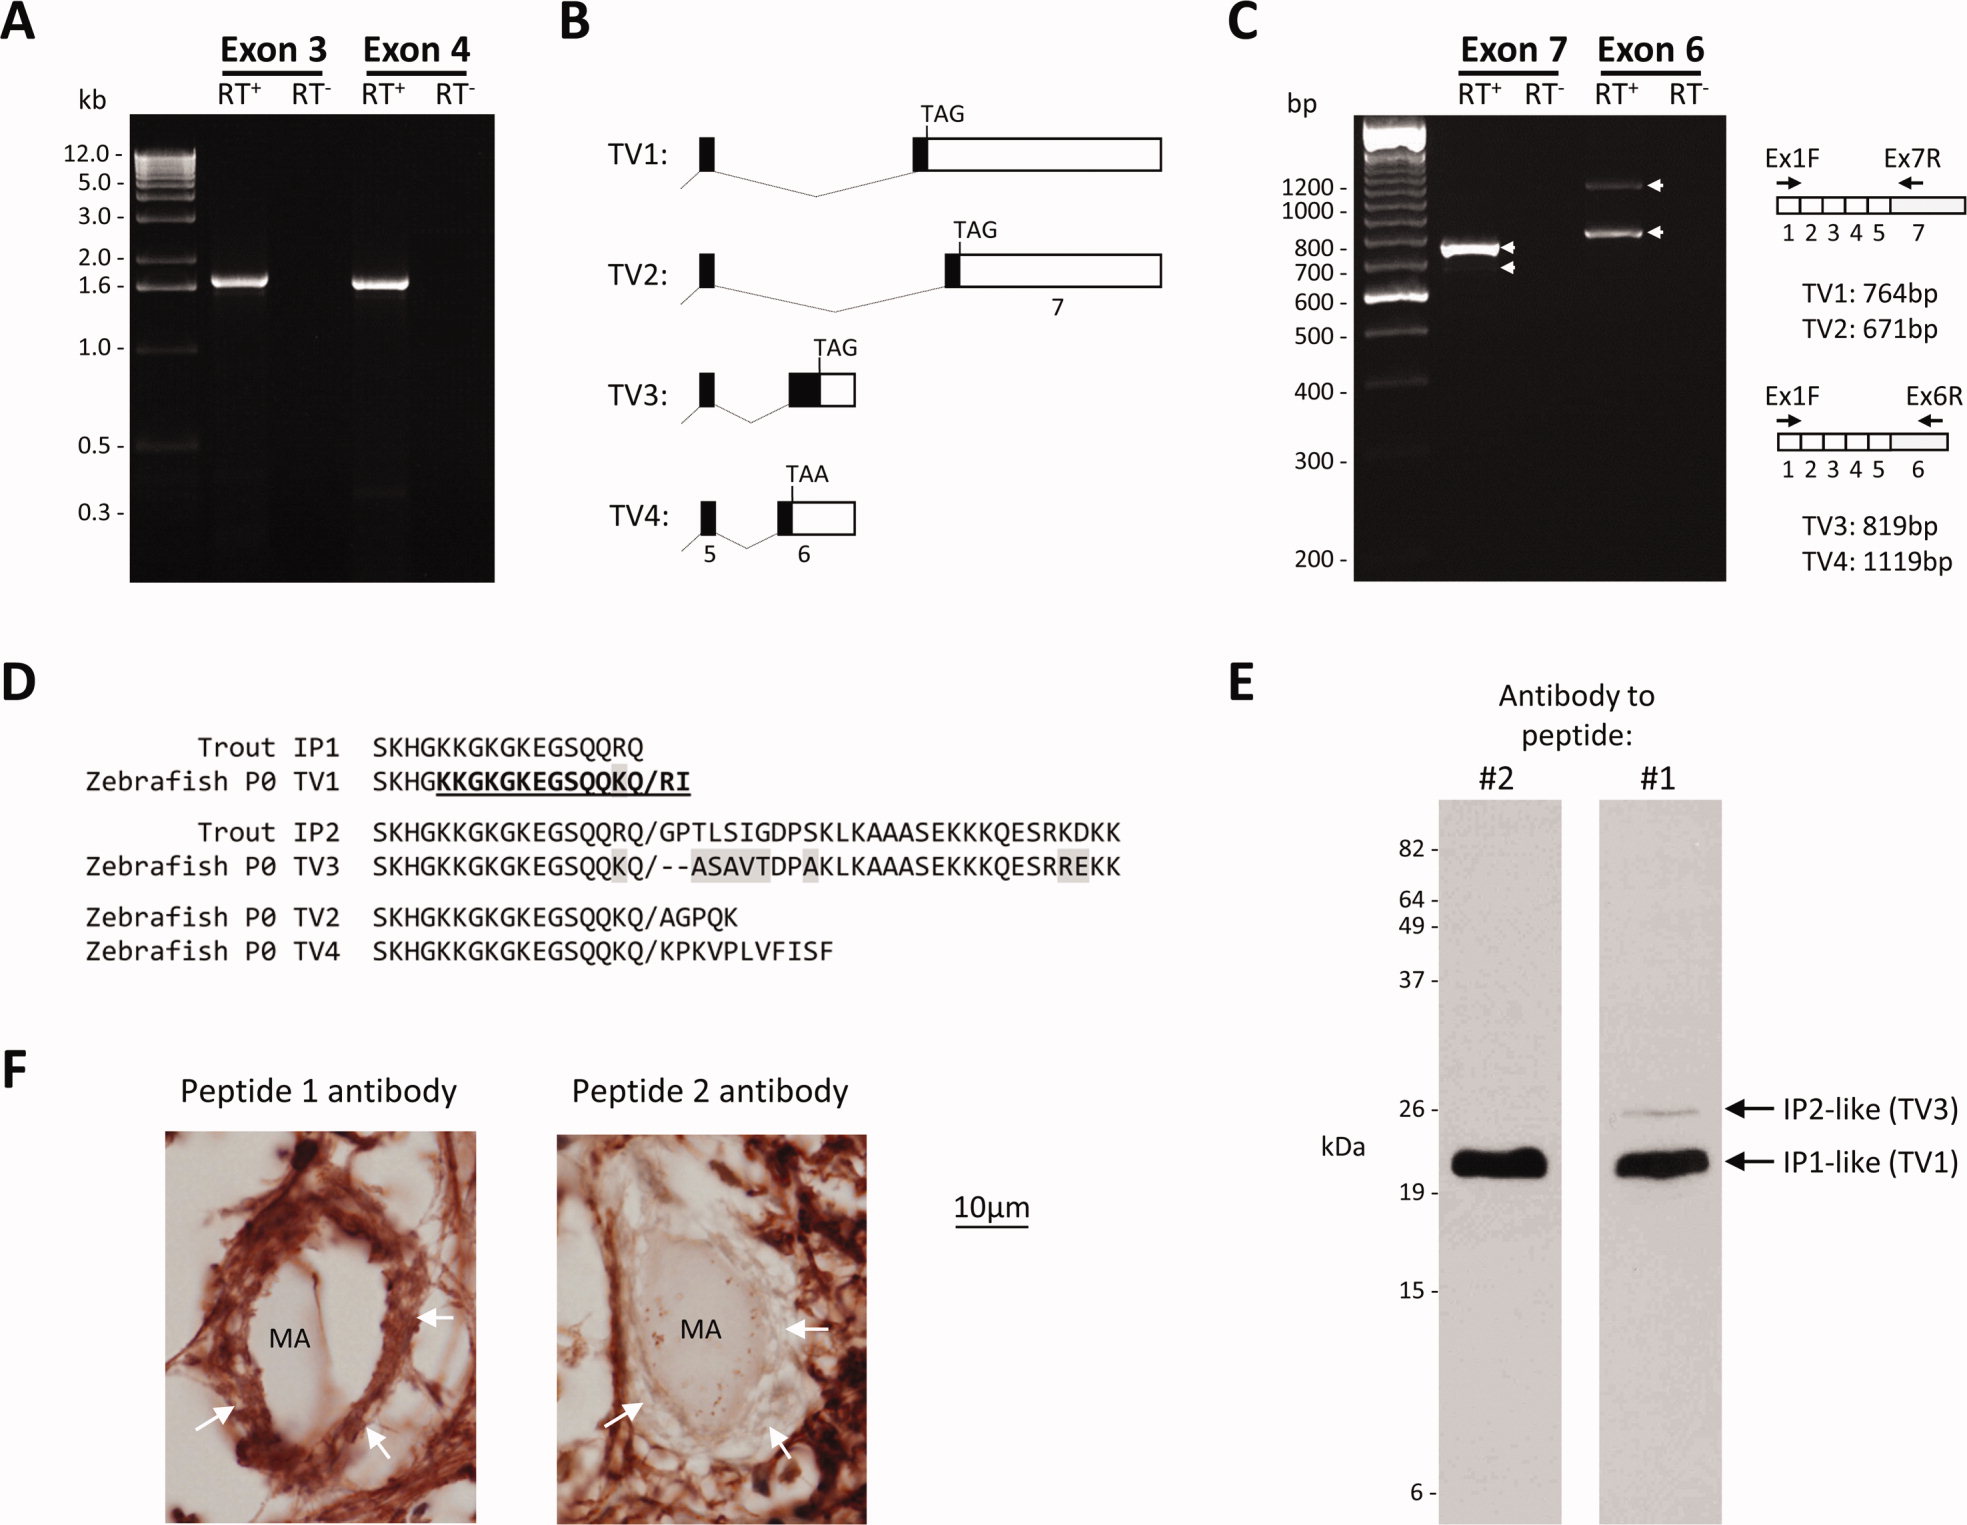
Alternative splicing of mpz gives rise to P0 isoforms with divergent C-termini. A: RNA derived from adult brain was subjected to reverse transcription using a 32RACE adapter primer (RT+, lanes 2 and 4), or treated with buffer alone (RT-, lanes 3 and 5). The resulting cDNA was subjected to PCR amplification using mpz-specific 52 primers hybridizing to exon 3 (lanes 2 and 3) or exon 4 (lanes 4 and 5), and a 32RACE adapter primer. Lane 1 shows a molecular marker; the sizes of the fragments (kb) are annotated to the left of the image. B: The diagram (not to scale) illustrates the splicing events giving rise to four mpz transcript variants (TV1–4). TV1 and TV2 were cloned by 32RACE; TV3 and TV4 were identified in silico and cloned by RT-PCR (see text). C: RNA derived from adult brain was subjected to reverse transcription using an oligo-dT primer (RT+, lanes 2 and 4), or treated with buffer alone (RT-, lanes 3 and 5). The resulting cDNA was subjected to PCR amplification using mpz-specific primers hybridizing to exon 1 and either exon 7 (lanes 2 and 3) or exon 6 (lanes 4 and 5). Lane 1 shows a molecular marker; the sizes of the fragments (bp) are annotated to the left of the image. The schematic to the right of the gel image illustrates the exon structures of the transcripts and the sizes of the expected PCR products for each transcript variant; arrows on the gel image delineate PCR products corresponding to the four transcript variants. D: The sequence alignment shows the C termini of the deduced P0 protein sequences encoded by the four zebrafish mpz transcript variants, and trout IP1 and IP2. The proteins encoded by mpz TV1 and TV3 show homology to trout IP1 and IP2, respectively. The sequence of peptide 2 used to generate the antibody used in Figures 2, 3, 4, 5, 6, 7, 2–7 is indicted within the sequence encoded by TV1 in bold type and underlined. Shading shows amino acid differences between the zebrafish and trout proteins. E: Identical western blots containing zebrafish whole brain lysate were probed using either the antibody to peptide 2 (shown in Figs. 2, 3, 4, 5, 6, 7, 2–7), or affinity-purified antibody to peptide 1. The additional 26 kDa band recognized by peptide 1 antibody is indicated. F: Photomicrographs showing high-magnification images of Mauthner axons in the ventral spinal cord, in cross-section. The myelin sheath of the Mauthner axon is indicated with white arrows. The section shown in the left panel was labeled with peptide 1 antibody (extracellular domain, sequence common to all isoforms). The section on the right was labeled with peptide 2 antibody (C-terminus, alternatively spliced). P0 immunoreactivity was revealed by a histochemical reaction with a red product.

