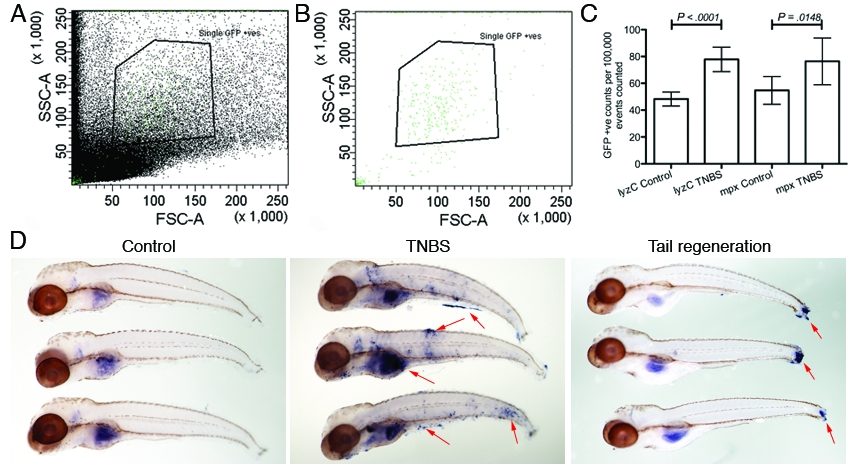
Fig. S8 Analysis of leukocytes by FACS and mmp9 expression. (A) and (B) Representative forward (FSC) and side (SSC) scatter characteristics of labeled leukocytes from whole larvae. (C) FACS analysis of GFP positive cell counts in TG(lyzC:EGFP) 117 (n=6, pools of 20 larvae) and TG(mpx:EGFP)114 (n=3, pools of 20 larvae) transgenic lines. All error bars represent a 95% confidence interval of the mean, P values calculated by matched t-test. (D) Whole mount in situ hybridization analysis of mmp9 expression in control, TNBS exposed and tail regenerating (3 days post wounding) specimens. Red arrows indicate induced mmp9 expression.
Image
Figure Caption
Acknowledgments
This image is the copyrighted work of the attributed author or publisher, and
ZFIN has permission only to display this image to its users.
Additional permissions should be obtained from the applicable author or publisher of the image.
Full text @ Dev. Dyn.

