
Image
|
Figure Caption
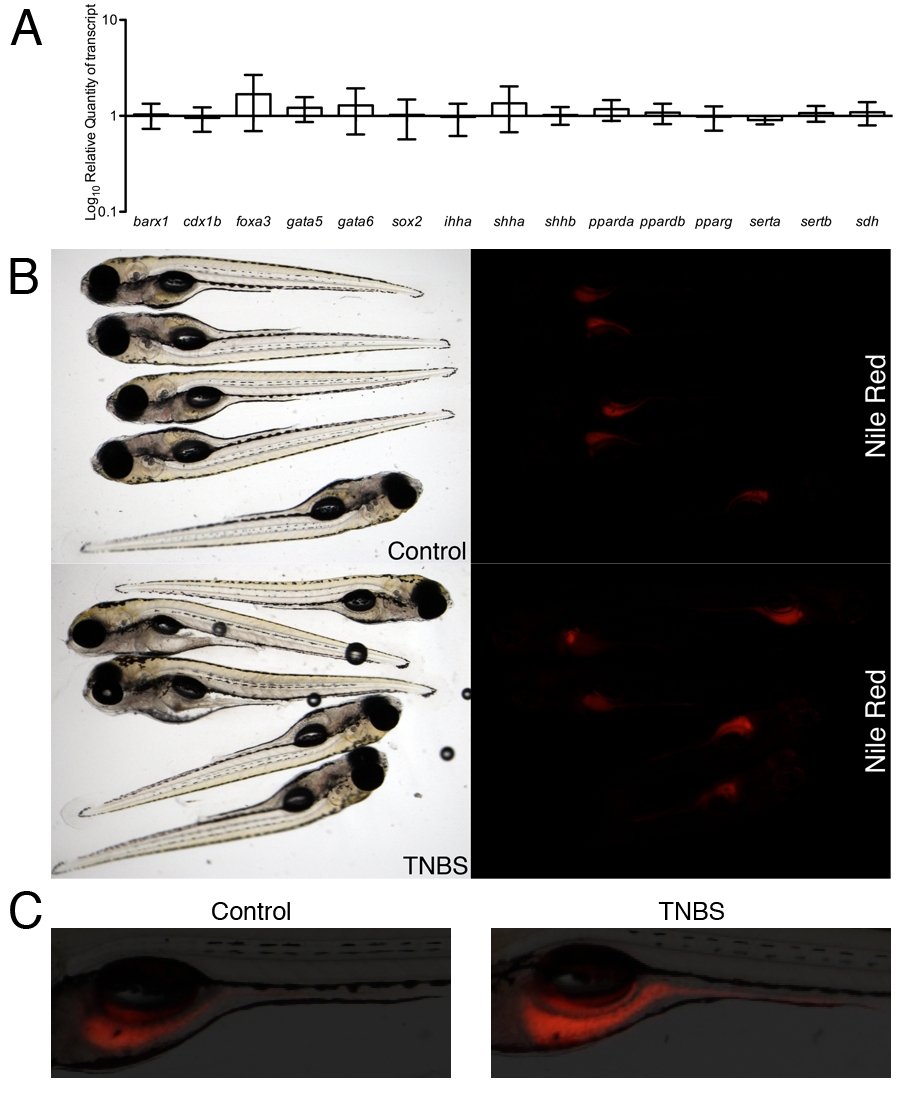
Fig. S4 Intestinal and extra-intestinal effects of TNBS exposure. (A) A panel of gut differentiation markers were analyzed by qPCR after TNBS exposure and compared with controls (RQ=1) (n=7, pools of 20 larvae). Error bars represent a 95% confidence interval. (B) Epifluorescent live imaging of Nile Red fluorescence in 6 dpf control and TNBS-exposed larvae. Specimens were photographed with the same magnification, illumination and exposure settings to preserve signal intensity differences. (C) Magnified and overlayed specimens stained with Nile Red.
Acknowledgments
This image is the copyrighted work of the attributed author or publisher, and
ZFIN has permission only to display this image to its users.
Additional permissions should be obtained from the applicable author or publisher of the image.
Full text @ Dev. Dyn.