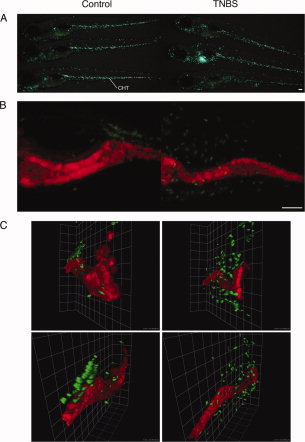
Fig. 5 Zebrafish larvae mount a leukocytic response to trinitrobenzene sulfonic acid (TNBS) exposure. Left column is control and right column is TNBS-exposed. A: Comparison of neutrophil distribution in 6 days postfertilization (dpf) TG(mpx:EGFP)114. Larvae exposed to TNBS demonstrated a redistribution of leukocytes away from the CHT region. B: Comparison of confocal microscopy images of double transgenic TG(mpx:EGFP114, ifabp:RFP) larvae expressing EGFP in neutrophils and RFP in intestinal epithelial cells. C: Three-dimensional reconstruction of confocal microscopy data illustrating two angles. Scale bars in A and B represent 100 μm. CHT, caudal hematopoietic tissue. EGFP, enhanced green fluorescent protein. RFP, red fluorescent protein.
Image
Figure Caption
Figure Data
Acknowledgments
This image is the copyrighted work of the attributed author or publisher, and
ZFIN has permission only to display this image to its users.
Additional permissions should be obtained from the applicable author or publisher of the image.
Full text @ Dev. Dyn.

