
|
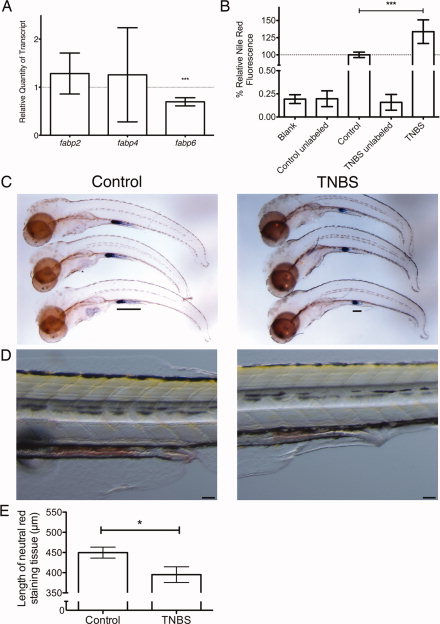
Fig. 3 Changes to intestinal physiology caused by trinitrobenzene sulfonic acid (TNBS) exposure. A: Analysis of the fatty acid binding protein family expression measured by quantitative polymerase chain reaction (qPCR) after TNBS exposure and compared with control (n = 10, pools of 20 larvae, P value calculated by one-sided t-test against a hypothetical mean of 1). B: Nile Red fluorescence in larvae exposed to TNBS expressed as a percentage of signal detected in control larvae (n = 10, pools of 5 larvae, P value calculated by t-test). C,D: Comparison of mid-intestinal markers in control (left column) and TNBS-exposed (right column) larvae, in situ hybridization for fabp6 transcripts (C), bar indicates length of staining, and neutral red staining of highly endocytic epithelium (D). Scale bar represents 100 μm. E: Quantification of 6 days postfertilization (dpf) larval mid-intestinal length marked by neutral red staining. All error bars represent a 95% confidence interval of the mean. *P < 0.05, ***P < 0.001.