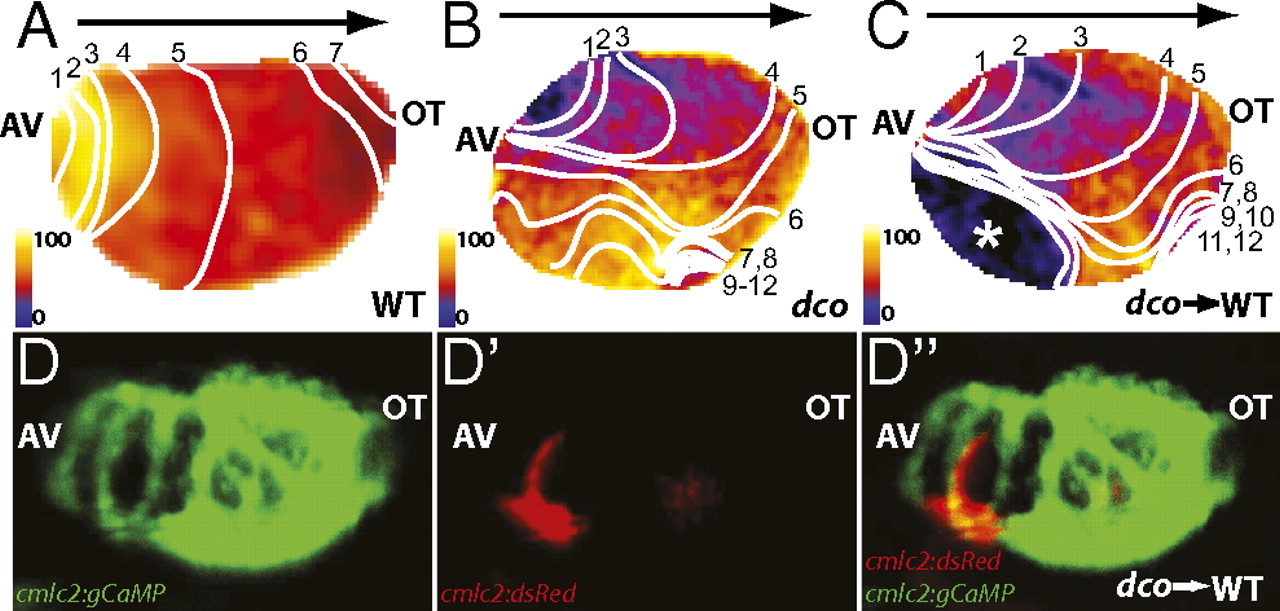
Fig. 2 Optical mapping/calcium imaging of dococs226 mutants reveals disrupted cardiac conduction. (A–C) Optical maps of calcium excitation during a single cardiac cycle, represented by isochronal lines every 20 ms in 60 hpf embryos carrying the Tg(cmlc2:gCaMP)s878 reporter and (A) WT at the dco locus (WT), (B) dcos226 homozygous mutant (dco), or (C) WT with dcos226 mutant cardiomyocytes carrying the Tg(cmlc2:dsRed)s879 reporter in the ventricle (dco → WT). Black arrow shows normal direction of ventricular cardiac conduction. Numbers indicate temporal sequence of calcium excitation. Color bar chart fluorescence intensity changes on a scale of 0 to 100. Cardiac conduction across the WT ventricle proceeds uniformly from the atrioventricular canal (AV) to the outflow tract (OT), whereas cardiac conduction travels aberrantly through the dcos226 mutant ventricle. Transplanted dcos226 mutant cardiomyocytes disrupt the organized AV to OT conduction in WT ventricle. White asterisk marks location of transplanted dco mutant cardiomyocytes in WT ventricle, as illustrated in D′ and D′′. (D and D′′) Fluorescent micrographs of the dco → WT mosaic heart imaged in C. (D) Green fluorescence shows the WT host ventricle; (D′) donor-derived dcos226 mutant cardiomyocytes expressing Tg(cmlc2:dsRed)s879. (D′′) Overlay of green and red fluorescence images reveals that the donor-derived dcos226 mutant cardiomyocytes are located at the outer curvature of the ventricle near the AV canal, where cardiac conduction is disrupted in the WT host ventricle (C).
Image
Figure Caption
Figure Data
Acknowledgments
This image is the copyrighted work of the attributed author or publisher, and
ZFIN has permission only to display this image to its users.
Additional permissions should be obtained from the applicable author or publisher of the image.
Full text @ Proc. Natl. Acad. Sci. USA

