Fig. 1
Fig. 1
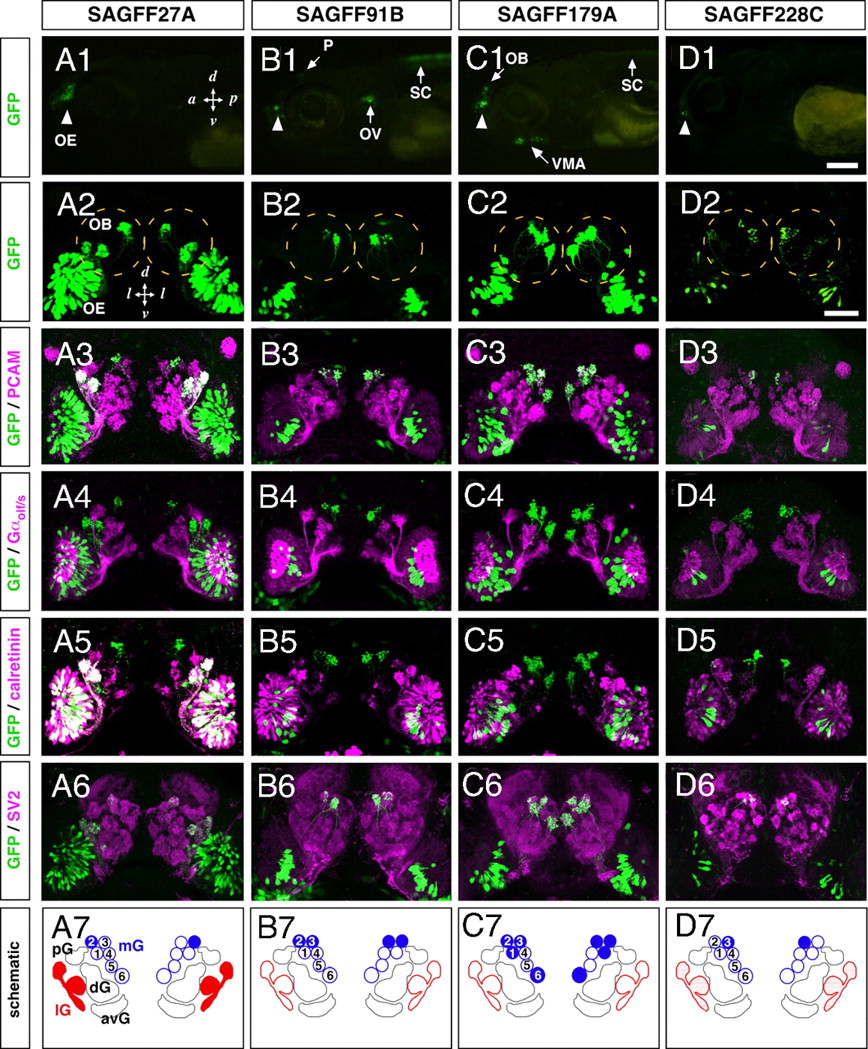
Gene trap zebrafish lines with Gal4FF expression in OSN subsets innervating distinct glomeruli. GFP expression patterns were examined in 5-day-old larvae of the 4 gene trap Gal4FF-expressing lines (A1–A7, SAGFF27A; B1–B7, SAGFF91B; C1–C7, SAGFF179A; and D1–D7, SAGFF228C) crossed with the UAS:GFP reporter strain. (A1–D1) Lateral views of transgenic larval heads with GAL4FF-driven GFP fluorescence in the OE (arrowheads). In SAGFF91B and SAGFF179A, additional fluorescent signals are observed. (B1) The otic vesicle (OV), pineal (P), and spinal cord (SC) in SAGFF91B. (C1) The ventral mandibular arch (VMA) and SC in SAGFF179A. (A2–D2) Frontal views of larvae showing GFP fluorescence in subsets of OSNs innervating the OB (dashed circles) with different patterns. (A3–D6) Whole-mount double-immunofluorescence labeling with antibodies against GFP (A3–D6; green) and PCAM (A3–D3; magenta), Gαolf/s (A4–D4; magenta), calretinin (A5–D5; magenta), or SV2 (A6–D6; magenta). (A7–D7) Schematic diagrams illustrating different patterns of glomerular innervation by Gal4FF-expressing OSNs in the gene trap lines. The 4 lines show different combinations of glomerular targeting in the medial cluster (mG1–6, blue). SAGFF27A and SAGFF228C also show strong and weak GFP expression, respectively, in OSNs innervating the lateral glomeruli (lG, red). avG, anteroventral glomeruli; dG, dorsal glomeruli; mG, medial glomeruli; pG, posterior glomeruli. [Scale bars: (in D1), A1–D1, 200 μm; (in D2), A2–D6, 50 μm.]

