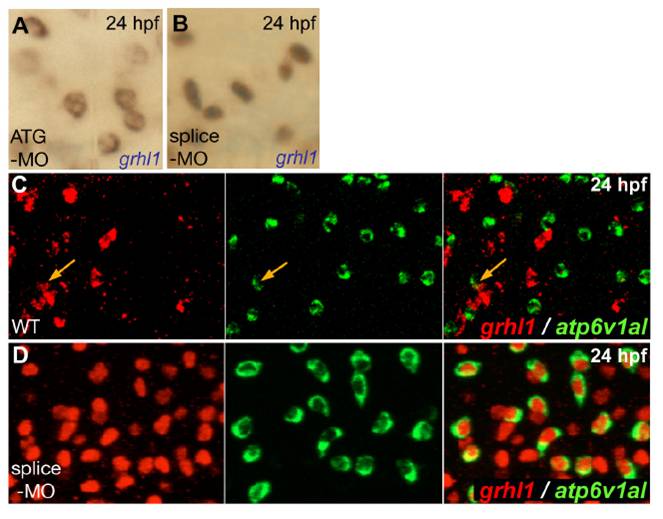
Fig. S7 grhl1 morphants display grhl1 expression in all ionocytes, with nuclear localisation when grhl1-splice MO, and cytoplasmic localisation when grhl1-ATG MO is used. All panels show in situ hybridisations at 24 hpf and with probes indicated in lower right corners. (A,B) Grhl1 transcripts were located in the nucleus upon injection of grhl1-splice-MO (B; also used in D), whereas they were cytoplasmic when grhl1-ATG-MO was used (A). (C,D) Double fluorescent in situ hybridisations indicating that in wild-type embryos (WT), only few ATPase6v1al-positive ionocytes (in green) were grhl1-positive (in red) (C; orange arrows), whereas in the grhl1 morphant (D), all ATPase6v1al-positive ionocytes contained nuclear grhl1 transcripts; anterior trunk region; left and middle pictures show single channels, right picture merged image.
Image
Figure Caption
Acknowledgments
This image is the copyrighted work of the attributed author or publisher, and
ZFIN has permission only to display this image to its users.
Additional permissions should be obtained from the applicable author or publisher of the image.
Full text @ Int. J. Dev. Biol.

