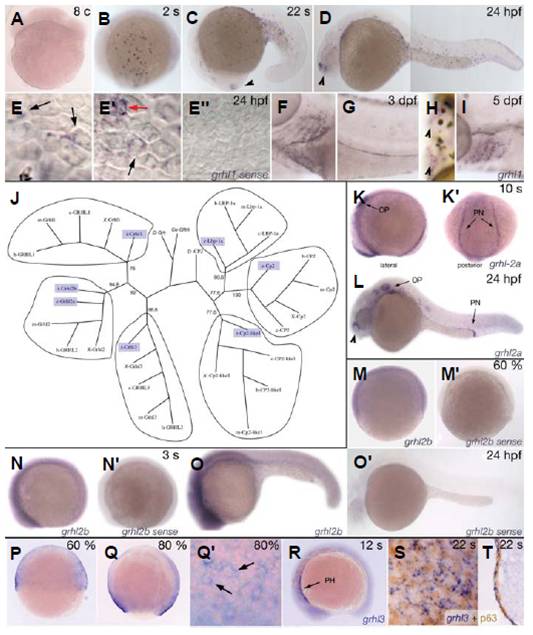
Fig. 1 Of all zebrafish grhl-cp2 homologs, only grhl1 and grhl3 display specific expression in the embryonic skin. All panels except (J) show whole mount in situ hybridisations of wildtype embryos at stages indicated in the upper right corner and probes indicated in the lower right corner (c, cells; s, somites; %, % epiboly). (A-I) Expression of grhl1; (E′′) control staining with sense probe. Black arrowheads in (C,D,H,L) point to the olfactory placodes. (E-E′′) High magnifications of the tail fin, with peridermal cells in focus (recognizable by their hexagonal shape). Black arrows point to staining in the superficial peridermal cells, the red arrow in (E′) to a single cell in the underlying basal epidermis that expresses high levels of grhl1. (K-L) Staining for grhl2a. (M-O′) Expression of grhl2b with an antisense (M-O) and sense probe (M′-O′). (P-T) Expression of grhl3, with (Q′) displaying a magnified view on the enveloping layer (future periderm; black arrows point to single cells) of the embryo shown in (Q). All panels except (F,H,K′ ,T) show lateral views with anterior/vegetal to the left. (F,H) Ventral views with anterior to the left; (K′) is a posterior view with dorsal up, and (T) shows a transverse section at the trunk level. (J) An unrooted phylogenetic tree based on positional variation within regions of sequences that aligned across all identified (boxed) and published Grainyhead/CP2 proteins using the neighborjoining algorithm. Bootstrap values in % based on 1000 replicates are indicated for the major branching points. Abbreviations: OP, otic placode; PH, pharynx; PN, pronephros.
Image
Figure Caption
Figure Data
Acknowledgments
This image is the copyrighted work of the attributed author or publisher, and
ZFIN has permission only to display this image to its users.
Additional permissions should be obtained from the applicable author or publisher of the image.
Full text @ Int. J. Dev. Biol.

