
Image
|
Figure Caption
Fig. S10
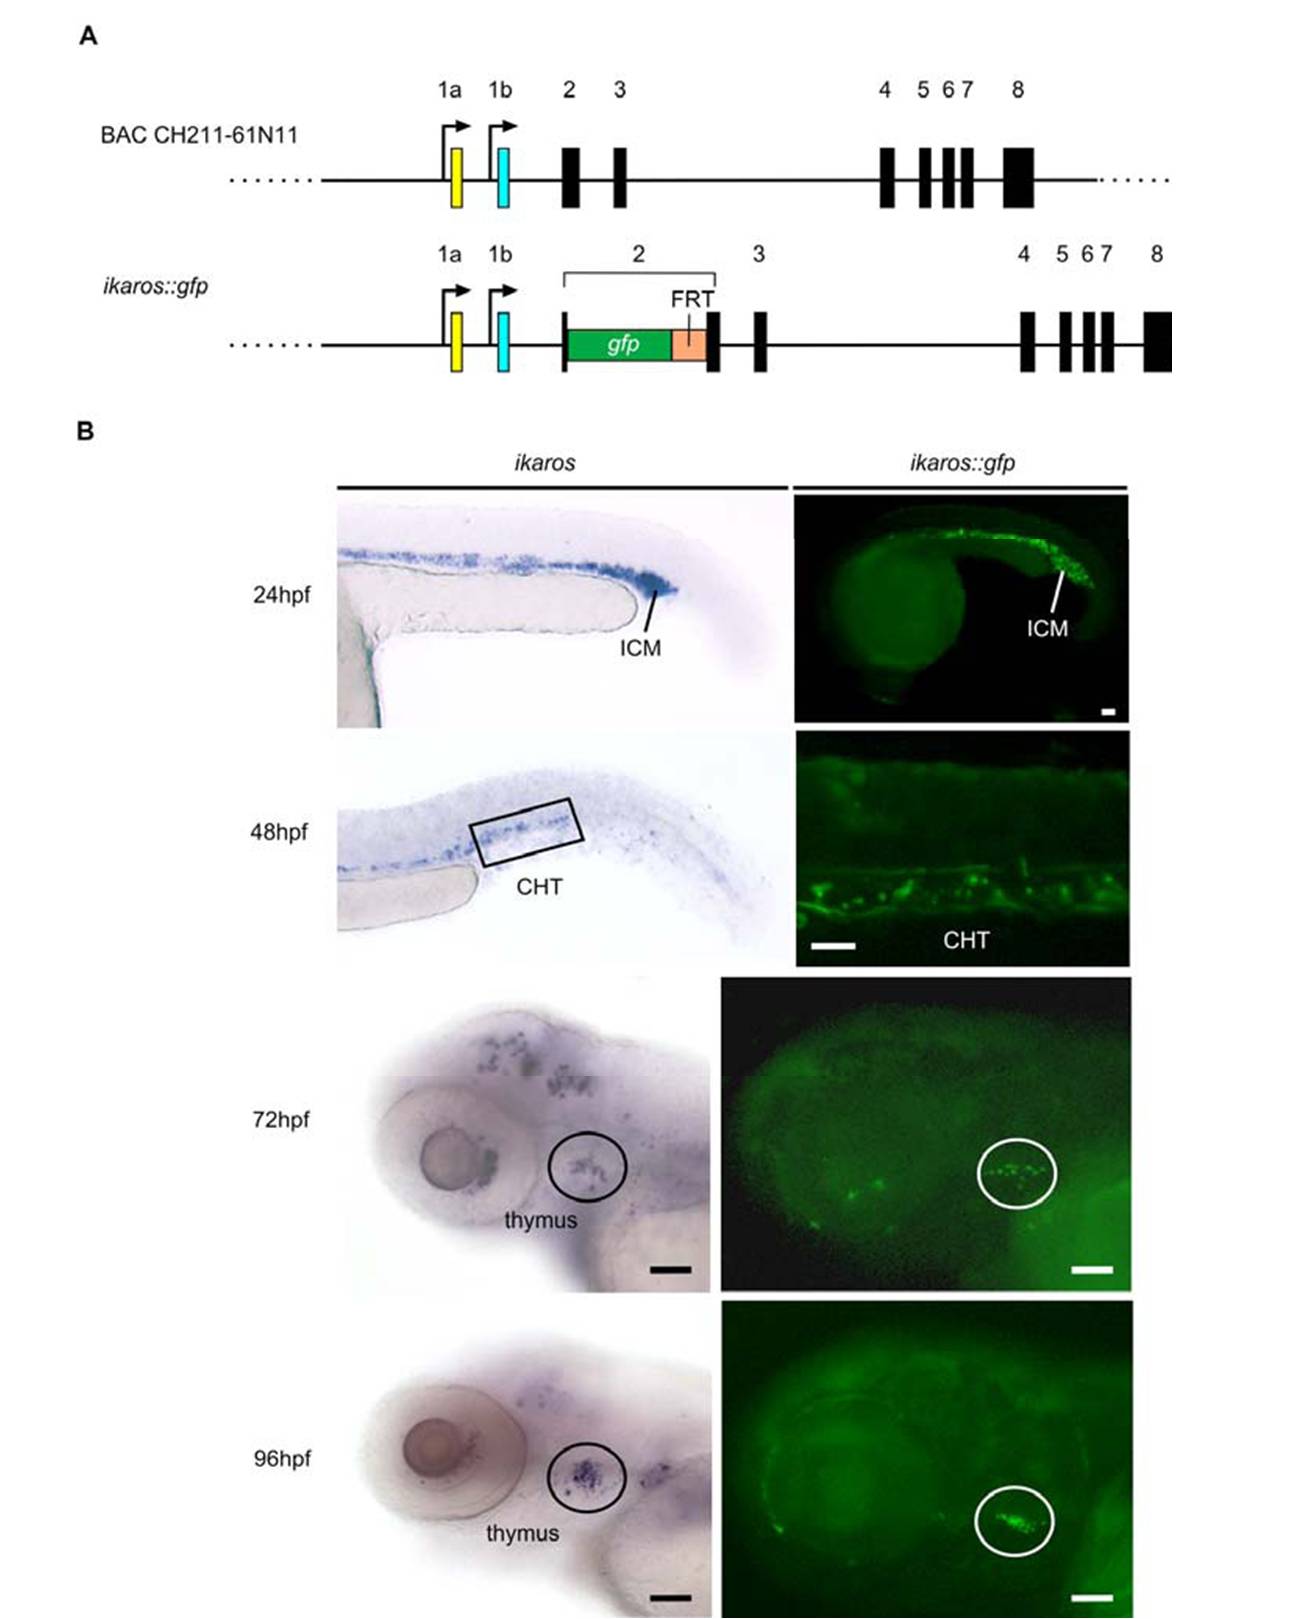
Characterization of the ikaros::gfp zebrafish transgenic line.
(A) Schematic description of the wild-type ikaros locus (upper panel) and the modified locus with insertion of gfp in the second exon. The BAC identification number is given.
(B) Expression of gfp in lymphoid tissues corresponds to endogenous ikaros expression, as revealed by comparative analysis at various time points. ICM, intermediate cell mass; CHT, caudal hematopoietic tissue; the thymus is encircled. Note that the strength of gfp signal in brain structures depends on the exact con-focal plane of analysis. Size bars, 50μm.
Figure Data
Acknowledgments
This image is the copyrighted work of the attributed author or publisher, and
ZFIN has permission only to display this image to its users.
Additional permissions should be obtained from the applicable author or publisher of the image.
Reprinted from Cell, 138(1), Bajoghli, B., Aghaallaei, N., Hess, I., Rode, I., Netuschil, N., Tay, B.H., Venkatesh, B., Yu, J.K., Kaltenbach, S.L., Holland, N.D., Diekhoff, D., Happe, C., Schorpp, M., and Boehm, T., Evolution of genetic networks underlying the emergence of thymopoiesis in vertebrates, 186-197, Copyright (2009) with permission from Elsevier. Full text @ Cell