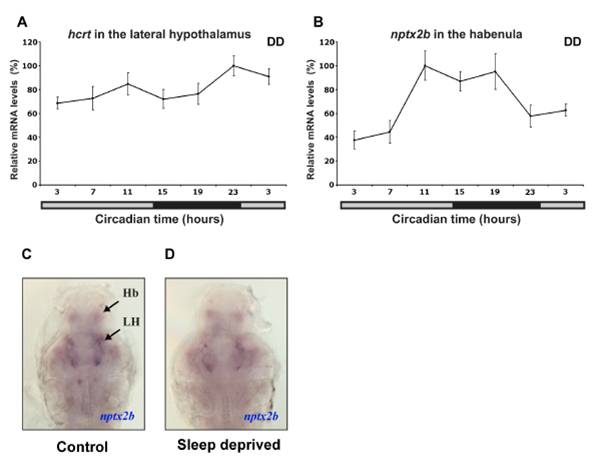
Fig. S5 Rhythmic and arrhythmic expression of nptx2b and hcrt, respectively. (A, B) Time course analysis under constant darkness (DD, gray bar represents subjective day) in adult brain sections using in situ hybridization (ISH). Endogenous nptx2b expression in the habenula (B) is rhythmic, mostly high during the night and low during the day, (repeated measure ANOVA, p<0.05, n=7 per each time point) while hcrt expression is arrhythmic (A, n=7 per each time point). Both genes were tested in parallel in one ISH experiment under identical conditions. Each value represents mean ± SEM. (C, D) Representative nptx2b expression of control (C) and sleep deprived (D) 7dpf larvae are shown (ventral view with olfactory point to the top). No apparent differences were observed in the levels of nptx2b mRNA after 6 hours of sleep deprivation (SD, C versus D, n=25 per treatment). These experiments were performed in parallel (in sibling larvae) to the SD and c-fos ISH experiments shown in Figure 3.
Image
Figure Caption
Acknowledgments
This image is the copyrighted work of the attributed author or publisher, and
ZFIN has permission only to display this image to its users.
Additional permissions should be obtained from the applicable author or publisher of the image.
Full text @ Neuron

