
|
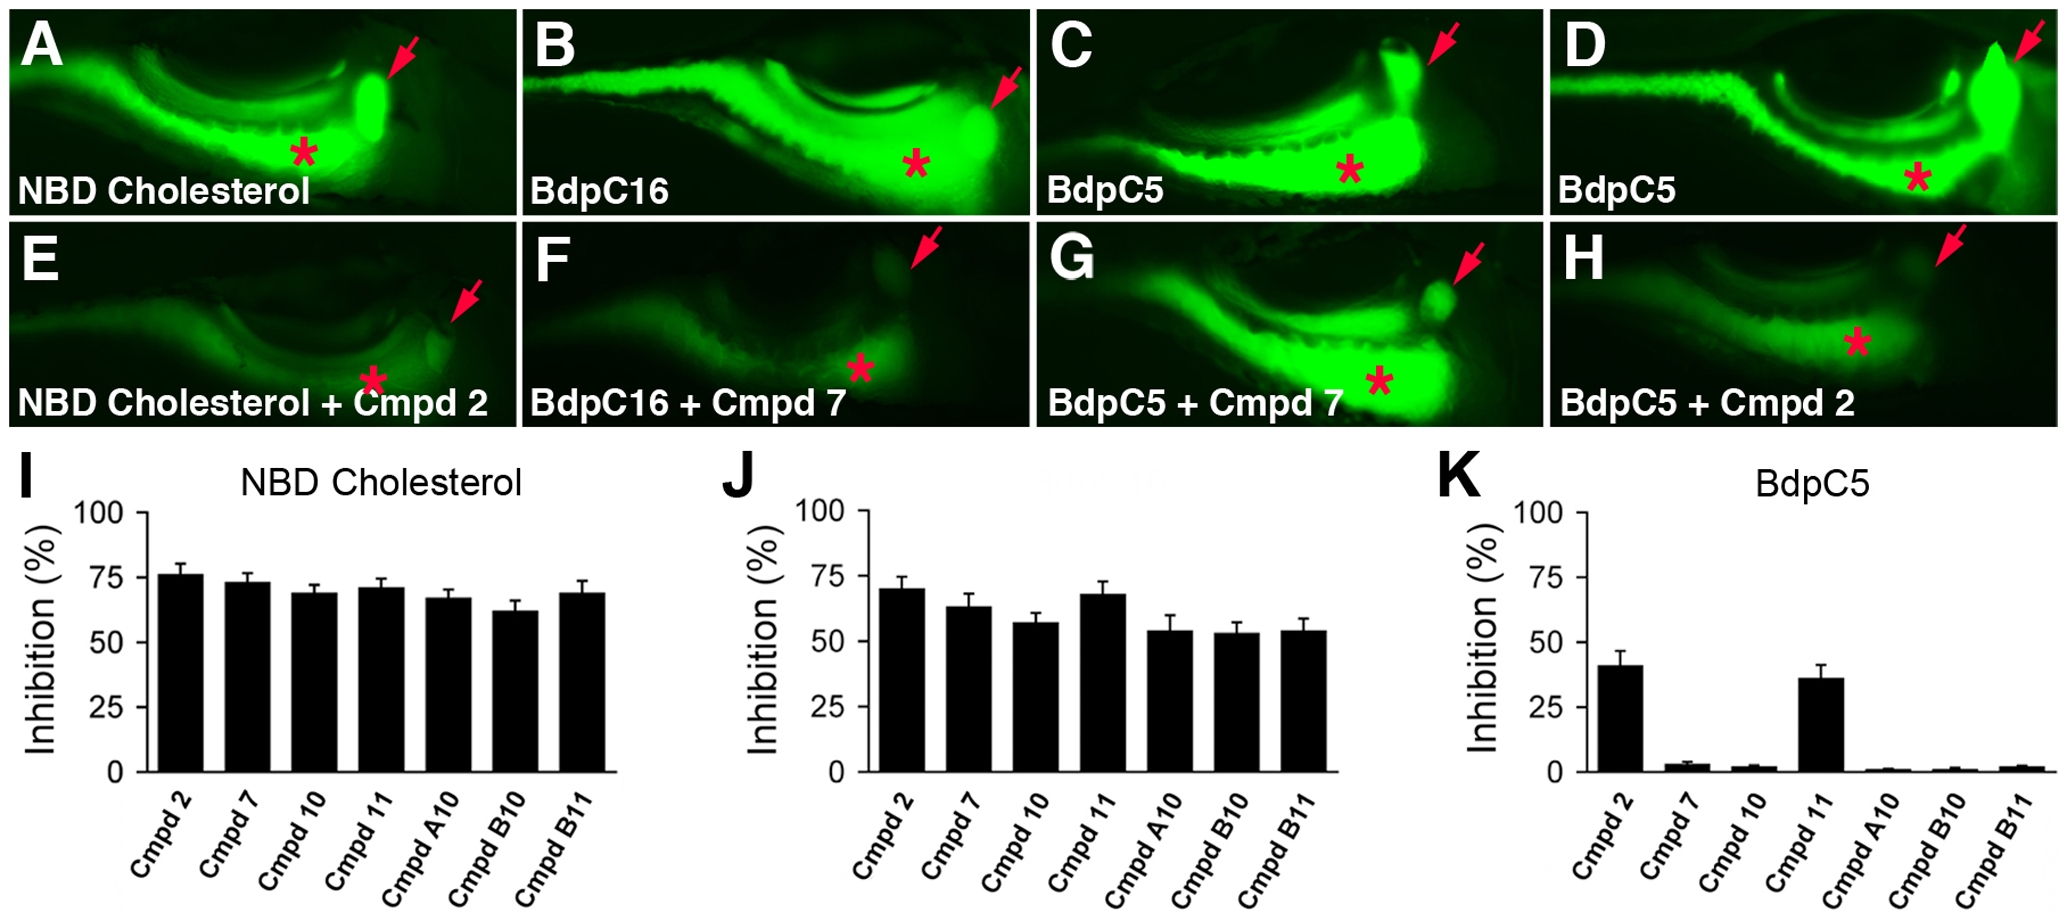
Fig. 2 Cholesterol and fatty acid metabolism in zebrafish larvae treated with novel lipid absorption inhibitors.
(A–H) Representative fluorescent images of live 6 day post-fertilization wild type and compound treated larvae following ingestion of NBD cholesterol (A, E), the LCFA BdpC16 (B, F), and the SCFA BdpC5 (C, D, G, H). All compounds used at 25 μM. Larvae treated with compound 2 showed reduced metabolism of NBD-cholesterol, BdpC16 (not shown), and BdpC5 whereas larvae treated with compound 7 have reduced metabolism of BdpC16, but not BdpC5. (I, J, K) Effect of the active compounds on lipid reporter metabolism, as determined by gallbladder and intestinal fluorescence measured from individual larvae. Red arrow - gallbladder; red asterisk - intestine. Error bars – standard deviation.