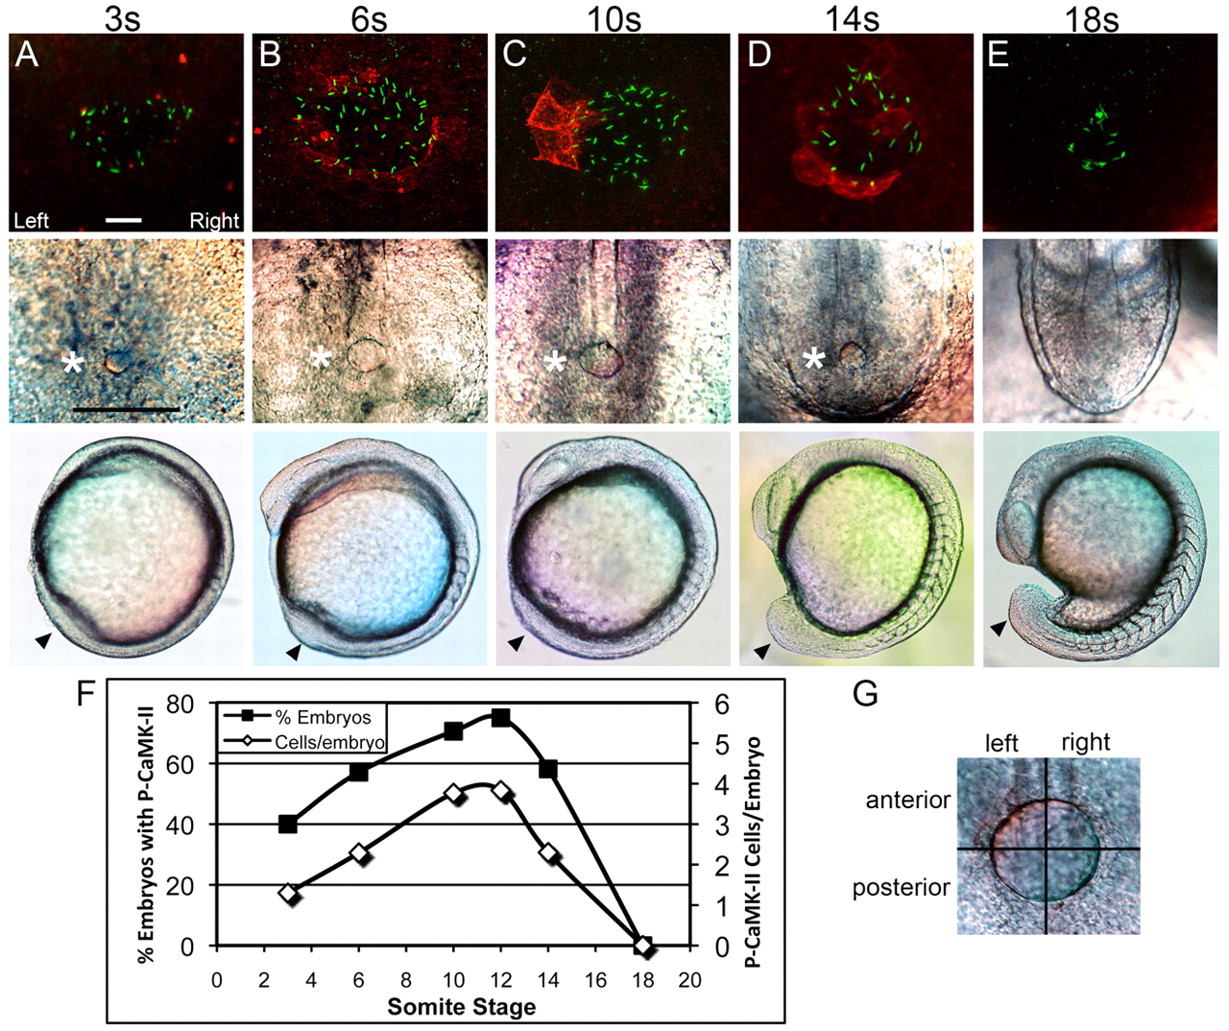
Fig. 2 Left-sided CaMK-II activation is transient. (A-E) The top row shows representative confocal immunofluorescent projections of P-T287 CaMK-II (red) and cilia (green) at the three- (A), six- (B), 10- (C), 14- (D) and 18- (E) somite stages. These projections of z-stacks were conducted as in Fig. 1 (12 somites) and are displayed at the same intensity. Scale bar: 10 μm. Middle row shows KV morphology (asterisk) from the same dorsal perspective. Scale bar: 100 μm. Bottom row shows the position of the KV (arrowheads) from the lateral perspective. (F) For each stage (n=14-36 embryos per stage), the percentage of embryos and the number of cells per embryo that exhibited activated CaMK-II was determined by inspecting z-stacks. (G) The location of KV cells exhibiting activated CaMK-II was scored in one of the four quadrants shown here and results can be found in Tables 1 and 2.
Image
Figure Caption
Figure Data
Acknowledgments
This image is the copyrighted work of the attributed author or publisher, and
ZFIN has permission only to display this image to its users.
Additional permissions should be obtained from the applicable author or publisher of the image.
Full text @ Development

