
|
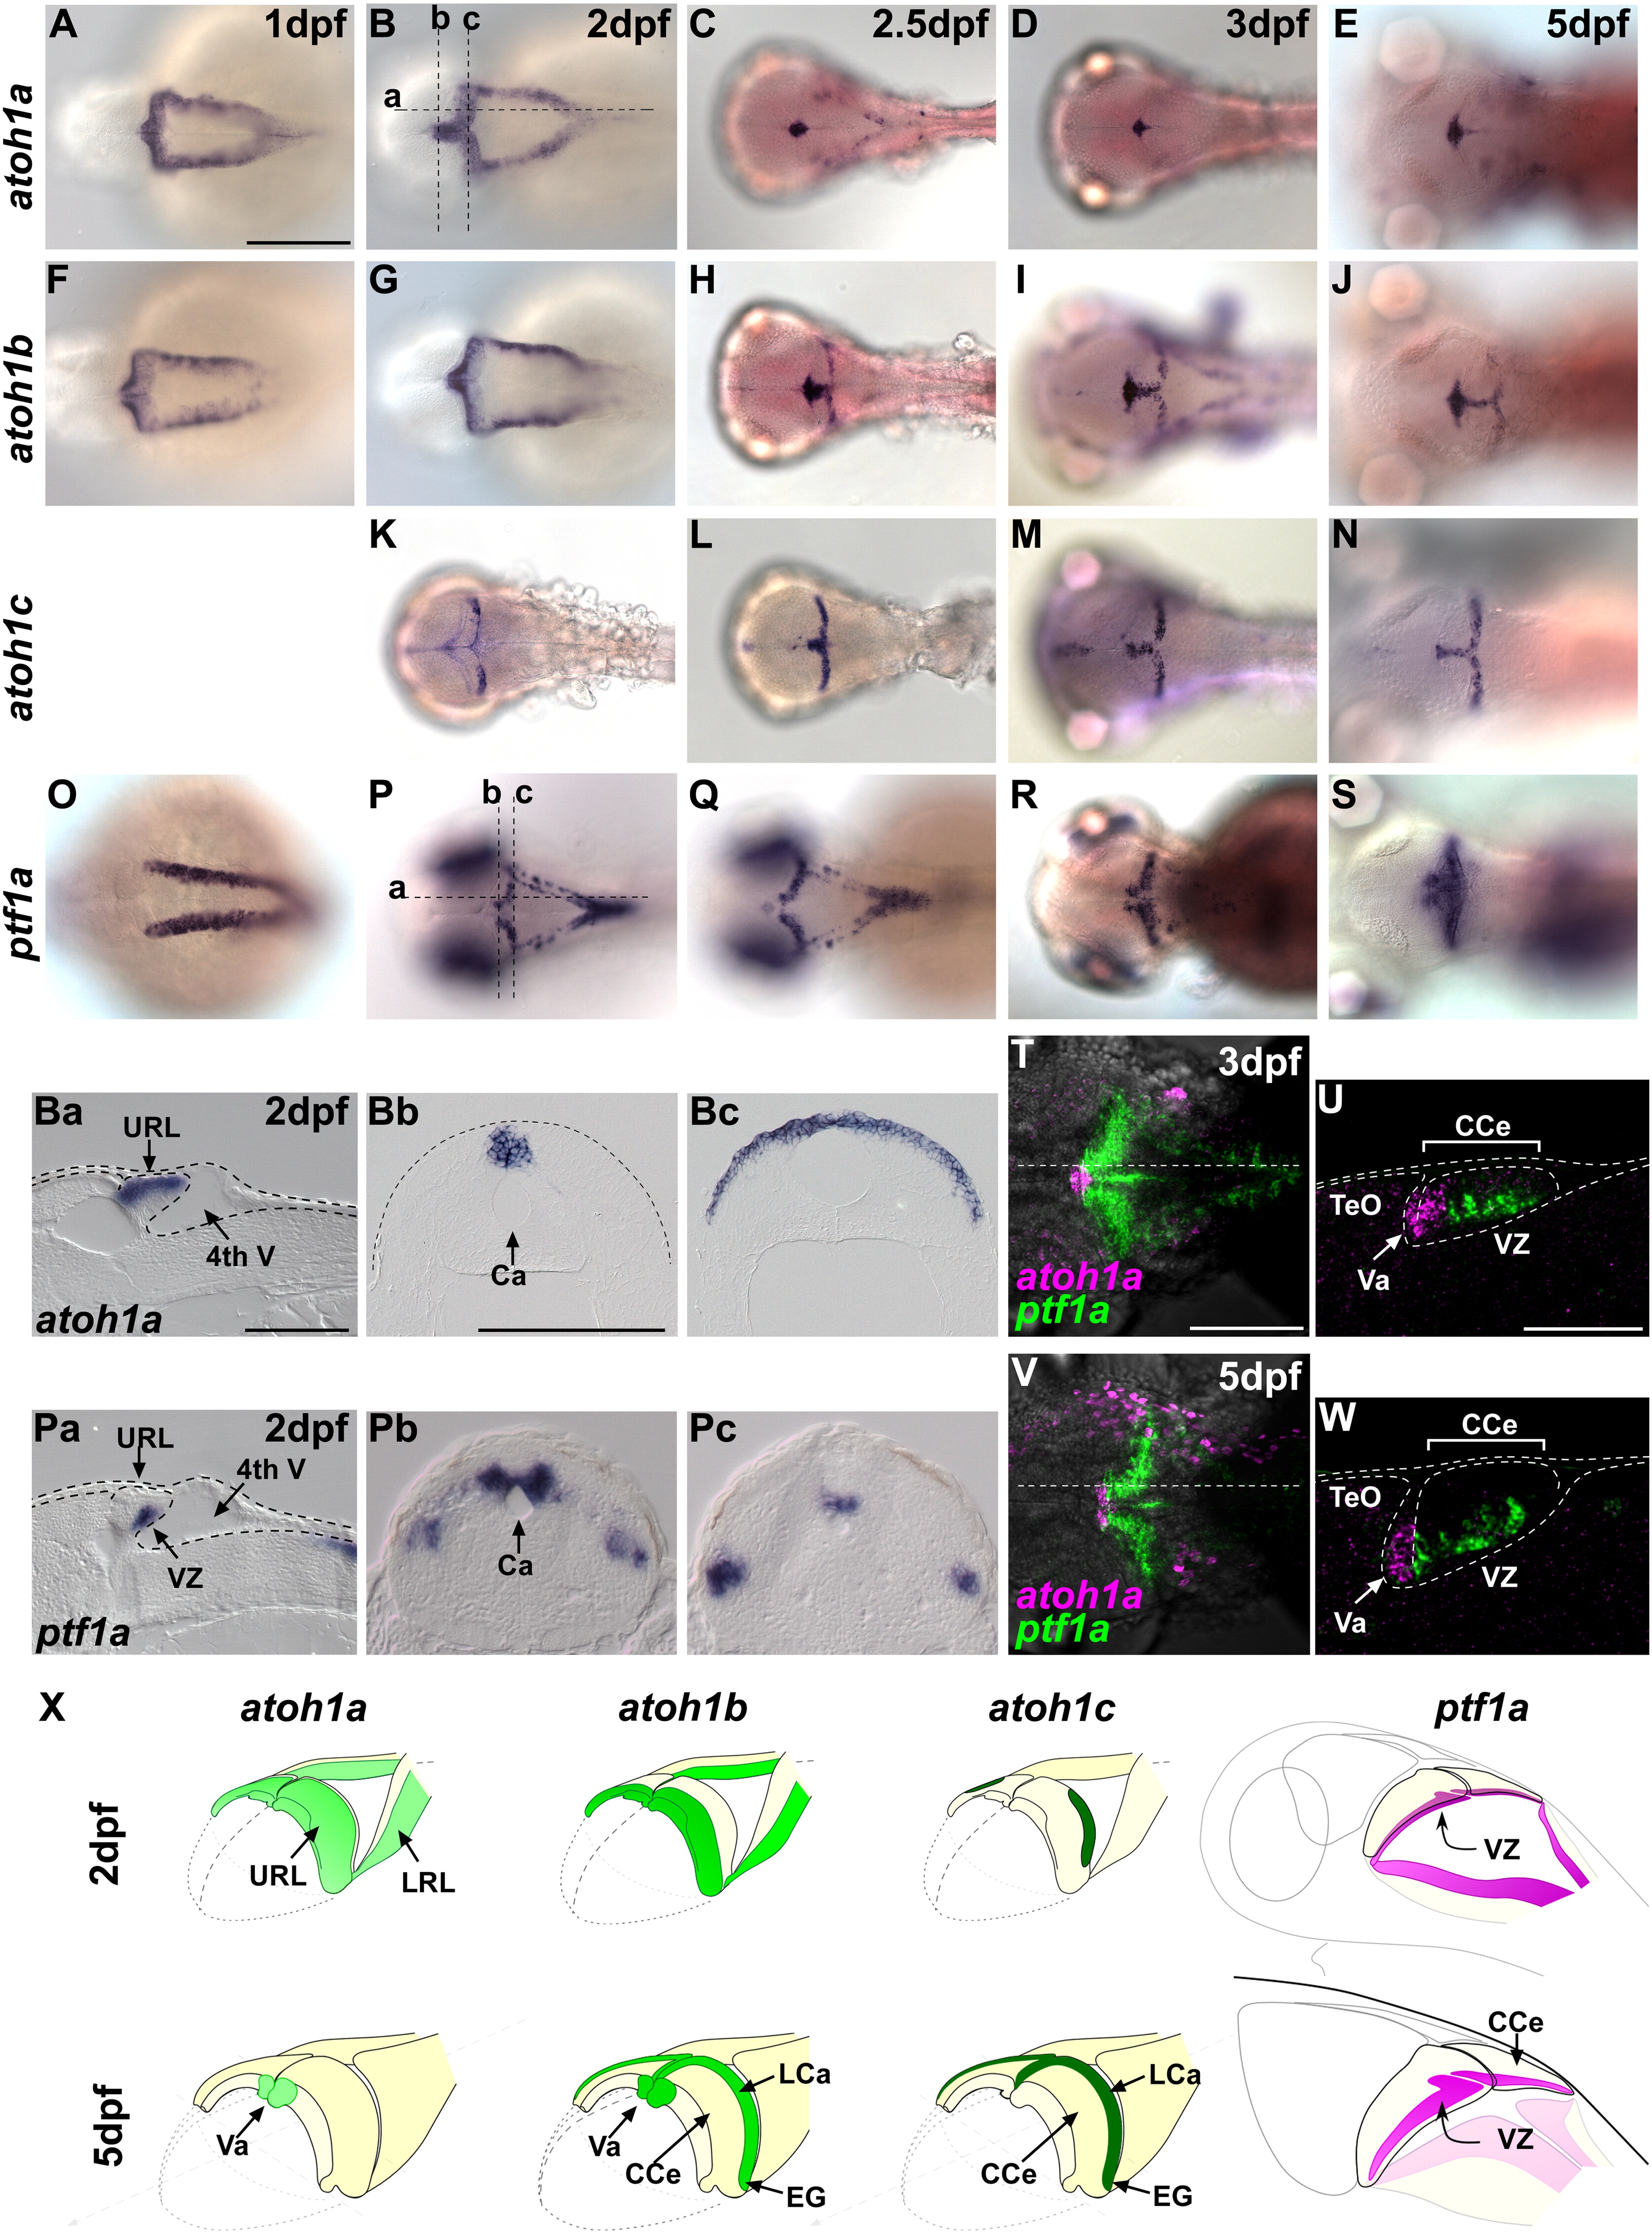
Fig. 1 Expression of proneural genes during cerebellar development. (A–S) Expression of atoh1a (A–E), atoh1b (F–J), atoh1c (K–N), and ptf1a (O–S) at dpf 1 (A, F, O), 2 (B, G, K, P), 2.5 (C, H, L, Q), 3 (D, I, M, R), and 5 (E, J, N, S). Dorsal views with rostral to the left. (Ba–c, Pa–c) Parasagittal (a) and cross sections (b, c) at the levels indicated in (B) and (P). (T–W) Co-staining of atoh1a and ptf1a expression at 3 (T, U) and 5 dpf (V, W). Dorsal views (T, V) and sagittal sections (U, W) at the levels indicated in (T) and (V). (X) Schematic representation of expression of atoh1a (light green), atoh1b (green), atoh1c (dark green), and ptf1a (pink) at 2 and 5 dpf. Ca, cerebral aqueduct; CCe, corpus cerebelli; EG, eminentia granularis; LCa, lobus caudalis cerebelli; LRL, lower rhombic lip; TeO, tectum opticum; URL, upper rhombic lip; Va, valvula cerebelli; VZ, ventricular zone; 4th V, fourth ventricle. Scale bars: 200 μm (A, T), 100 μm (Ba, Bb, U).
Reprinted from Developmental Biology, 343(1-2), Kani, S., Bae, Y.K., Shimizu, T., Tanabe, K., Satou, C., Parsons, M.J., Scott, E., Higashijima, S.I., and Hibi, M., Proneural gene-linked neurogenesis in zebrafish cerebellum, 1-17, Copyright (2010) with permission from Elsevier. Full text @ Dev. Biol.