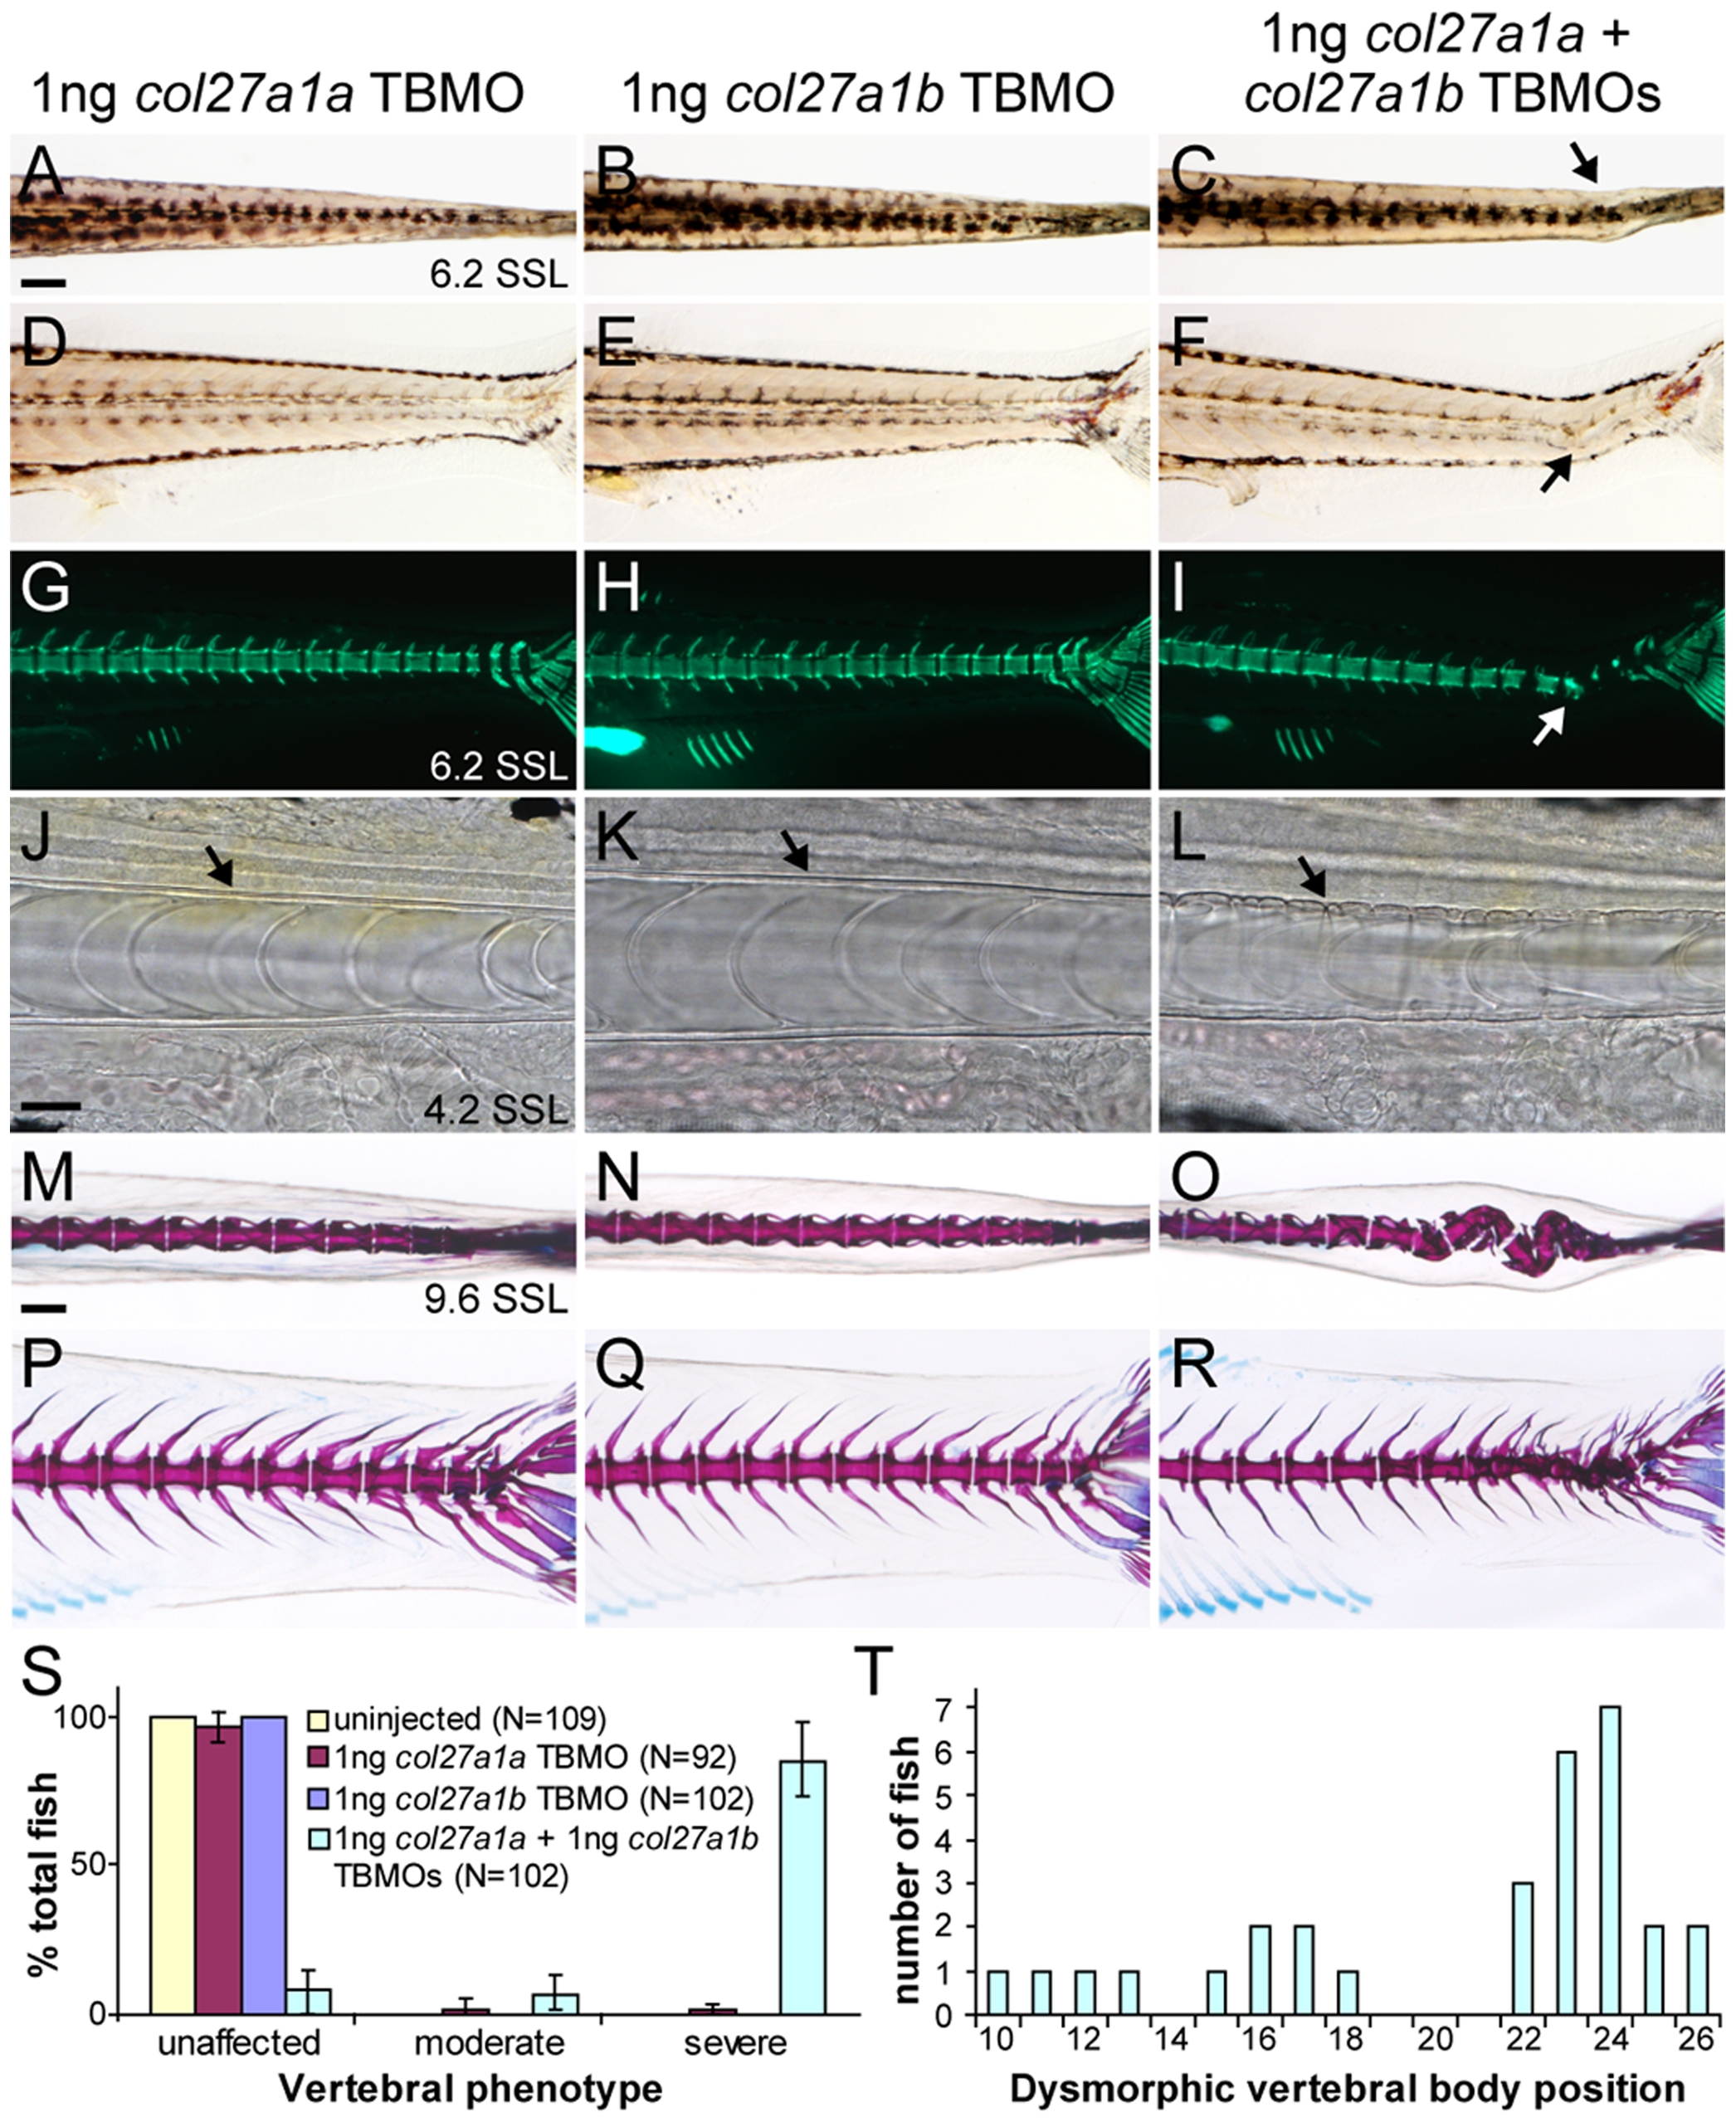
Fig. 7 col27a1a and col27a1b interact genetically in the notochord and axial skeleton.
Injection of col27a1a TBMO (A, D, G) and col27a1b TBMO (B, E, H) at low dosage did not result in a phenotype as seen at ∼6.2 SSL (14 dpf). (C, F) Simultaneous injection of col27a1a and col27a1b TBMOs at low dosage, however, resulted in notochord curves (black and white arrows). (I) Calcein staining to visualize mineral showed abnormal mineralization in double morphants. Brightfield analysis of col27a1a (J), col27a1b (K) and col27a1a and col27a1b double morphant (L) notochords at ∼4.2 SSL (8 dpf) showed severe buckling of the notochord sheath (black arrow) in double morphants. Dorsal and lateral views of col27a1a (M, P), col27a1b (N, Q) and double morphants (O, R) at ∼9.6–10 SSL (21 dpf) showed formation of scoliotic curves in the vertebral column of double morphants. (S) By ∼9.6–10 SSL, 92% of col27a1a and col27a1b double morphants had developed either moderate or severe vertebral defects, with the majority being very severe. The mean from 3 clutches±standard error is shown. (T) Dysmorphic vertebrae without hemal or neural spines were also observed in double morphants. These additional dysmorphic vertebrae were spread throughout the vertebral column but preferentially localized to a region near the distal end of the tail. Scale bars in A and M represent 200 μm and apply to B–I and N–R, respectively. Scale bar in J represents 20 μm and applies to K and L.

