
|
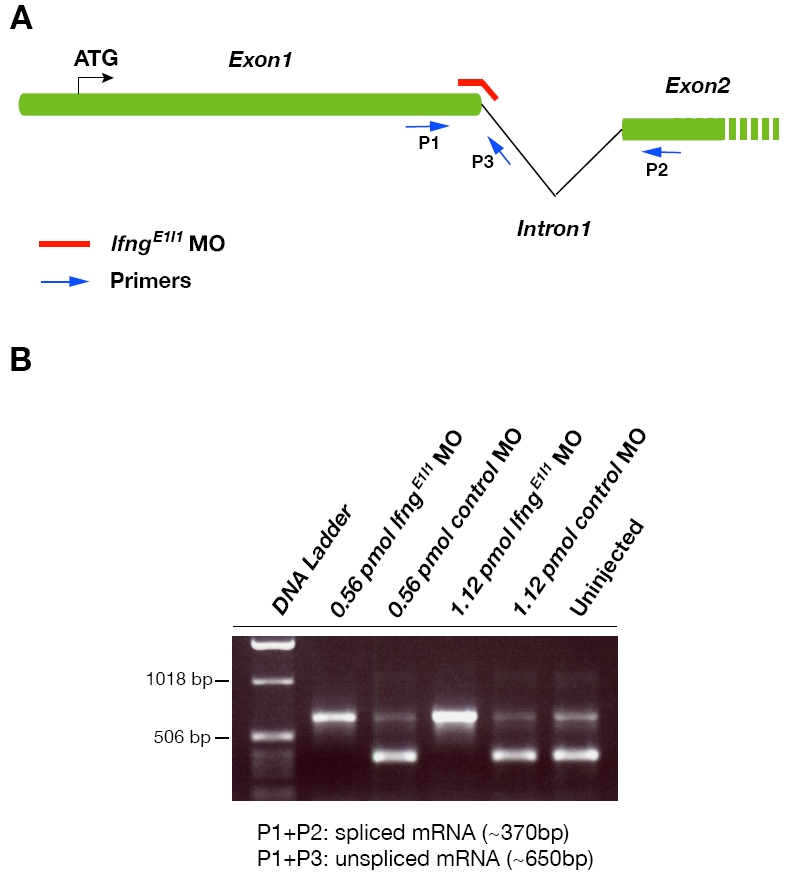
Fig. S1 lfng exon1-intron1 MO blocks the splicing of lfng pre-mRNA. (A) Diagram of lfng transcript organization between exon 1 and exon 2. Red line indicates the area in which lfngE1I1 MO binds. Blue arrows indicate the position and direction of the primers used (see Materials and methods). (B) The combinations of P1 with P2 and P1 with P3 produce two bands with different sizes that correspond to spliced and unspliced lfng pre-mRNA. Microinjection of two different doses of lfngE1I1 MO blocks splicing of lfng pre-mRNA, whereas the mismatch control MO injected at the same doses does not block splicing.