
Image
|
Figure Caption
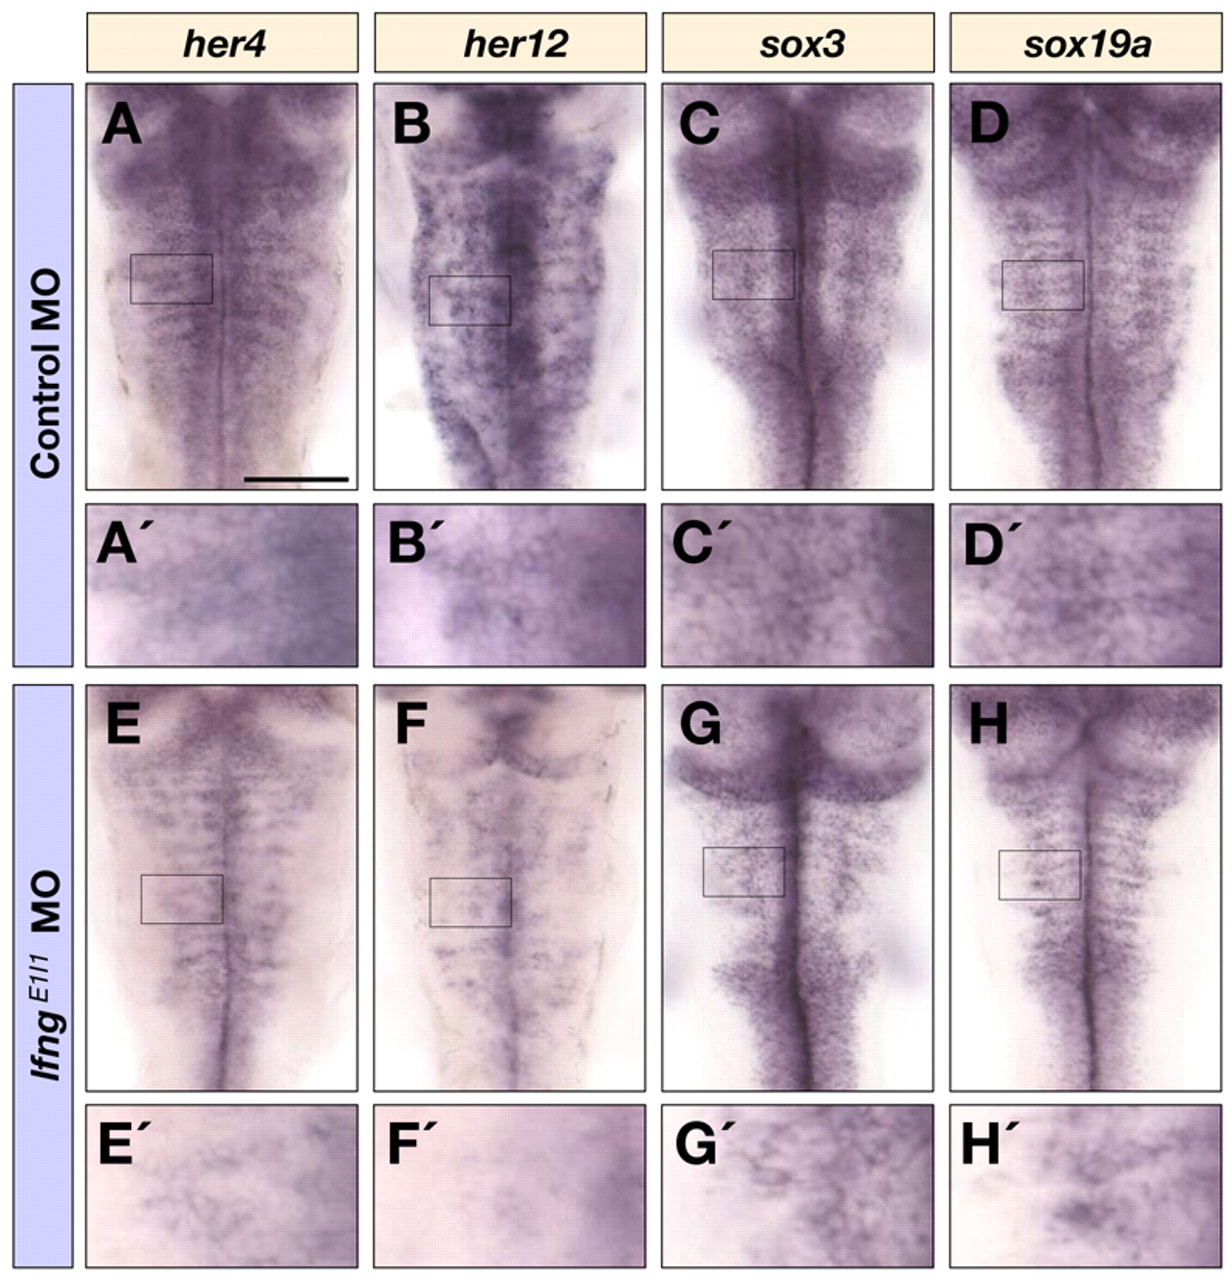
Fig. 4 Notch target gene and progenitor marker expression following lfng knockdown. Dorsal views of control MO (A-D′) and lfngE1I1 MO (E-H′) injected embryos at 40 hpf following detection of her4 (A,A′,E,E′), her12 (B,B′,F,F′), sox3 (C,C′,G,G′) and sox19a (D,D′,H,H′) mRNA in the hindbrain. A′-H′ are higher magnifications of the indicated areas in A-H. Scale bar: 100 μm.
Figure Data
Acknowledgments
This image is the copyrighted work of the attributed author or publisher, and
ZFIN has permission only to display this image to its users.
Additional permissions should be obtained from the applicable author or publisher of the image.
Full text @ Development