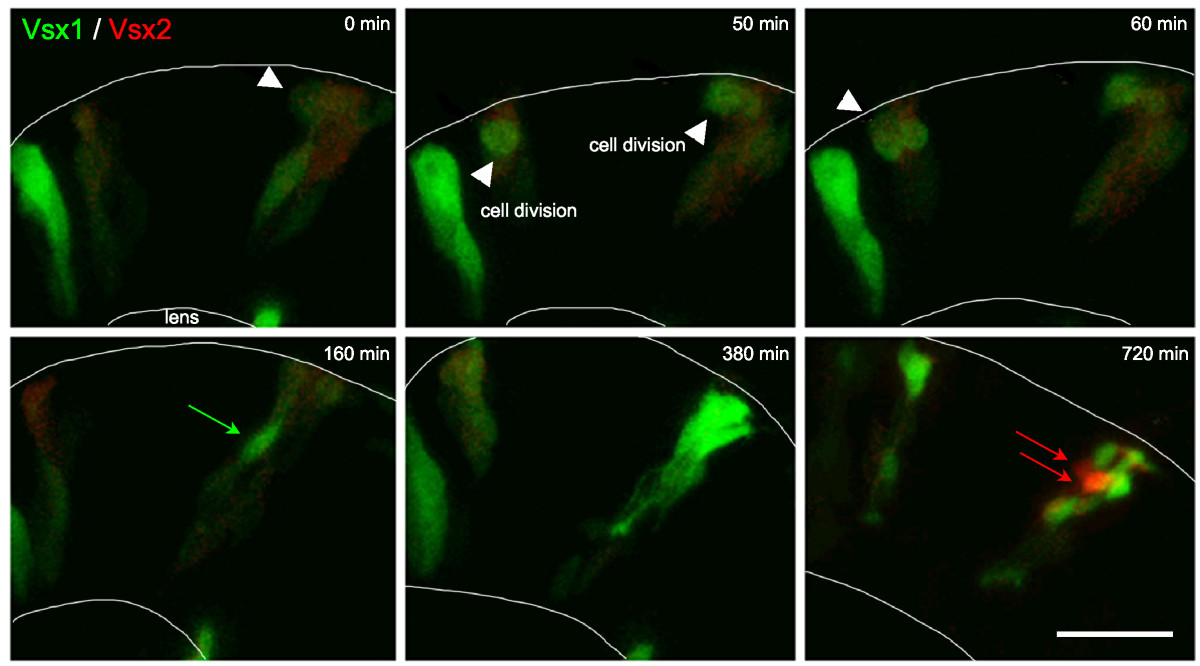
Fig. 5 Vsx2 versus Vsx1 arise from distinct lineages. Time-lapse images from Additional file 2 showing cells transplanted from Tg(vsx1:GFP; vsx2:dsRed) into wild type to reveal individual cell morphology. Vsx1:GFP progenitors that have already lost Vsx2:DsRed (green only) or are in the process of (weak red signal remaining in these green cells) downregulating Vsx2:DsRed divide apically (white arrowheads). They upregulate Vsx1:GFP (green arrows) and differentiate as a group of bipolar cells. Vsx2:DsRed is expressed at a low level initially. It fades in cells that turn on Vsx1:GFP, but the red signal also fades during the movie shown in Additional file 2 due to bleaching, so Vsx2:DsRed progenitors cannot be followed throughout the entire movie. Vsx2:DsRed is later dramatically upregulated in cells that do not express Vsx1 (red arrows). Scale bar: 20 μm.
Image
Figure Caption
Acknowledgments
This image is the copyrighted work of the attributed author or publisher, and
ZFIN has permission only to display this image to its users.
Additional permissions should be obtained from the applicable author or publisher of the image.
Full text @ Neural Dev.

