
Image
|
Figure Caption
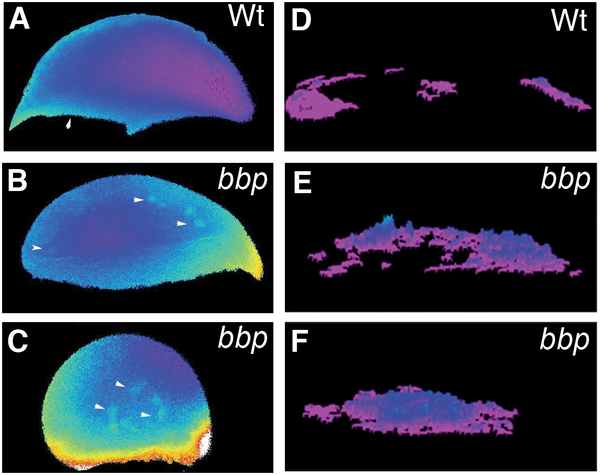
Fig. 4 Selected frames of ratiometric images of WT (A) and bbp at early epiboly (B) and bbp at 40% epiboly (C). Algorithm of the calcium release representing the frequency and location of fluxes for the duration of the time course of early WT embryo in A (D), early bbp embryo in B (E), and 40% epiboly bbp embryo in C (F). Composites represent data collected over 1 hour of imaging of an individual embryo.
Figure Data
Acknowledgments
This image is the copyrighted work of the attributed author or publisher, and
ZFIN has permission only to display this image to its users.
Additional permissions should be obtained from the applicable author or publisher of the image.
Full text @ PLoS Genet.