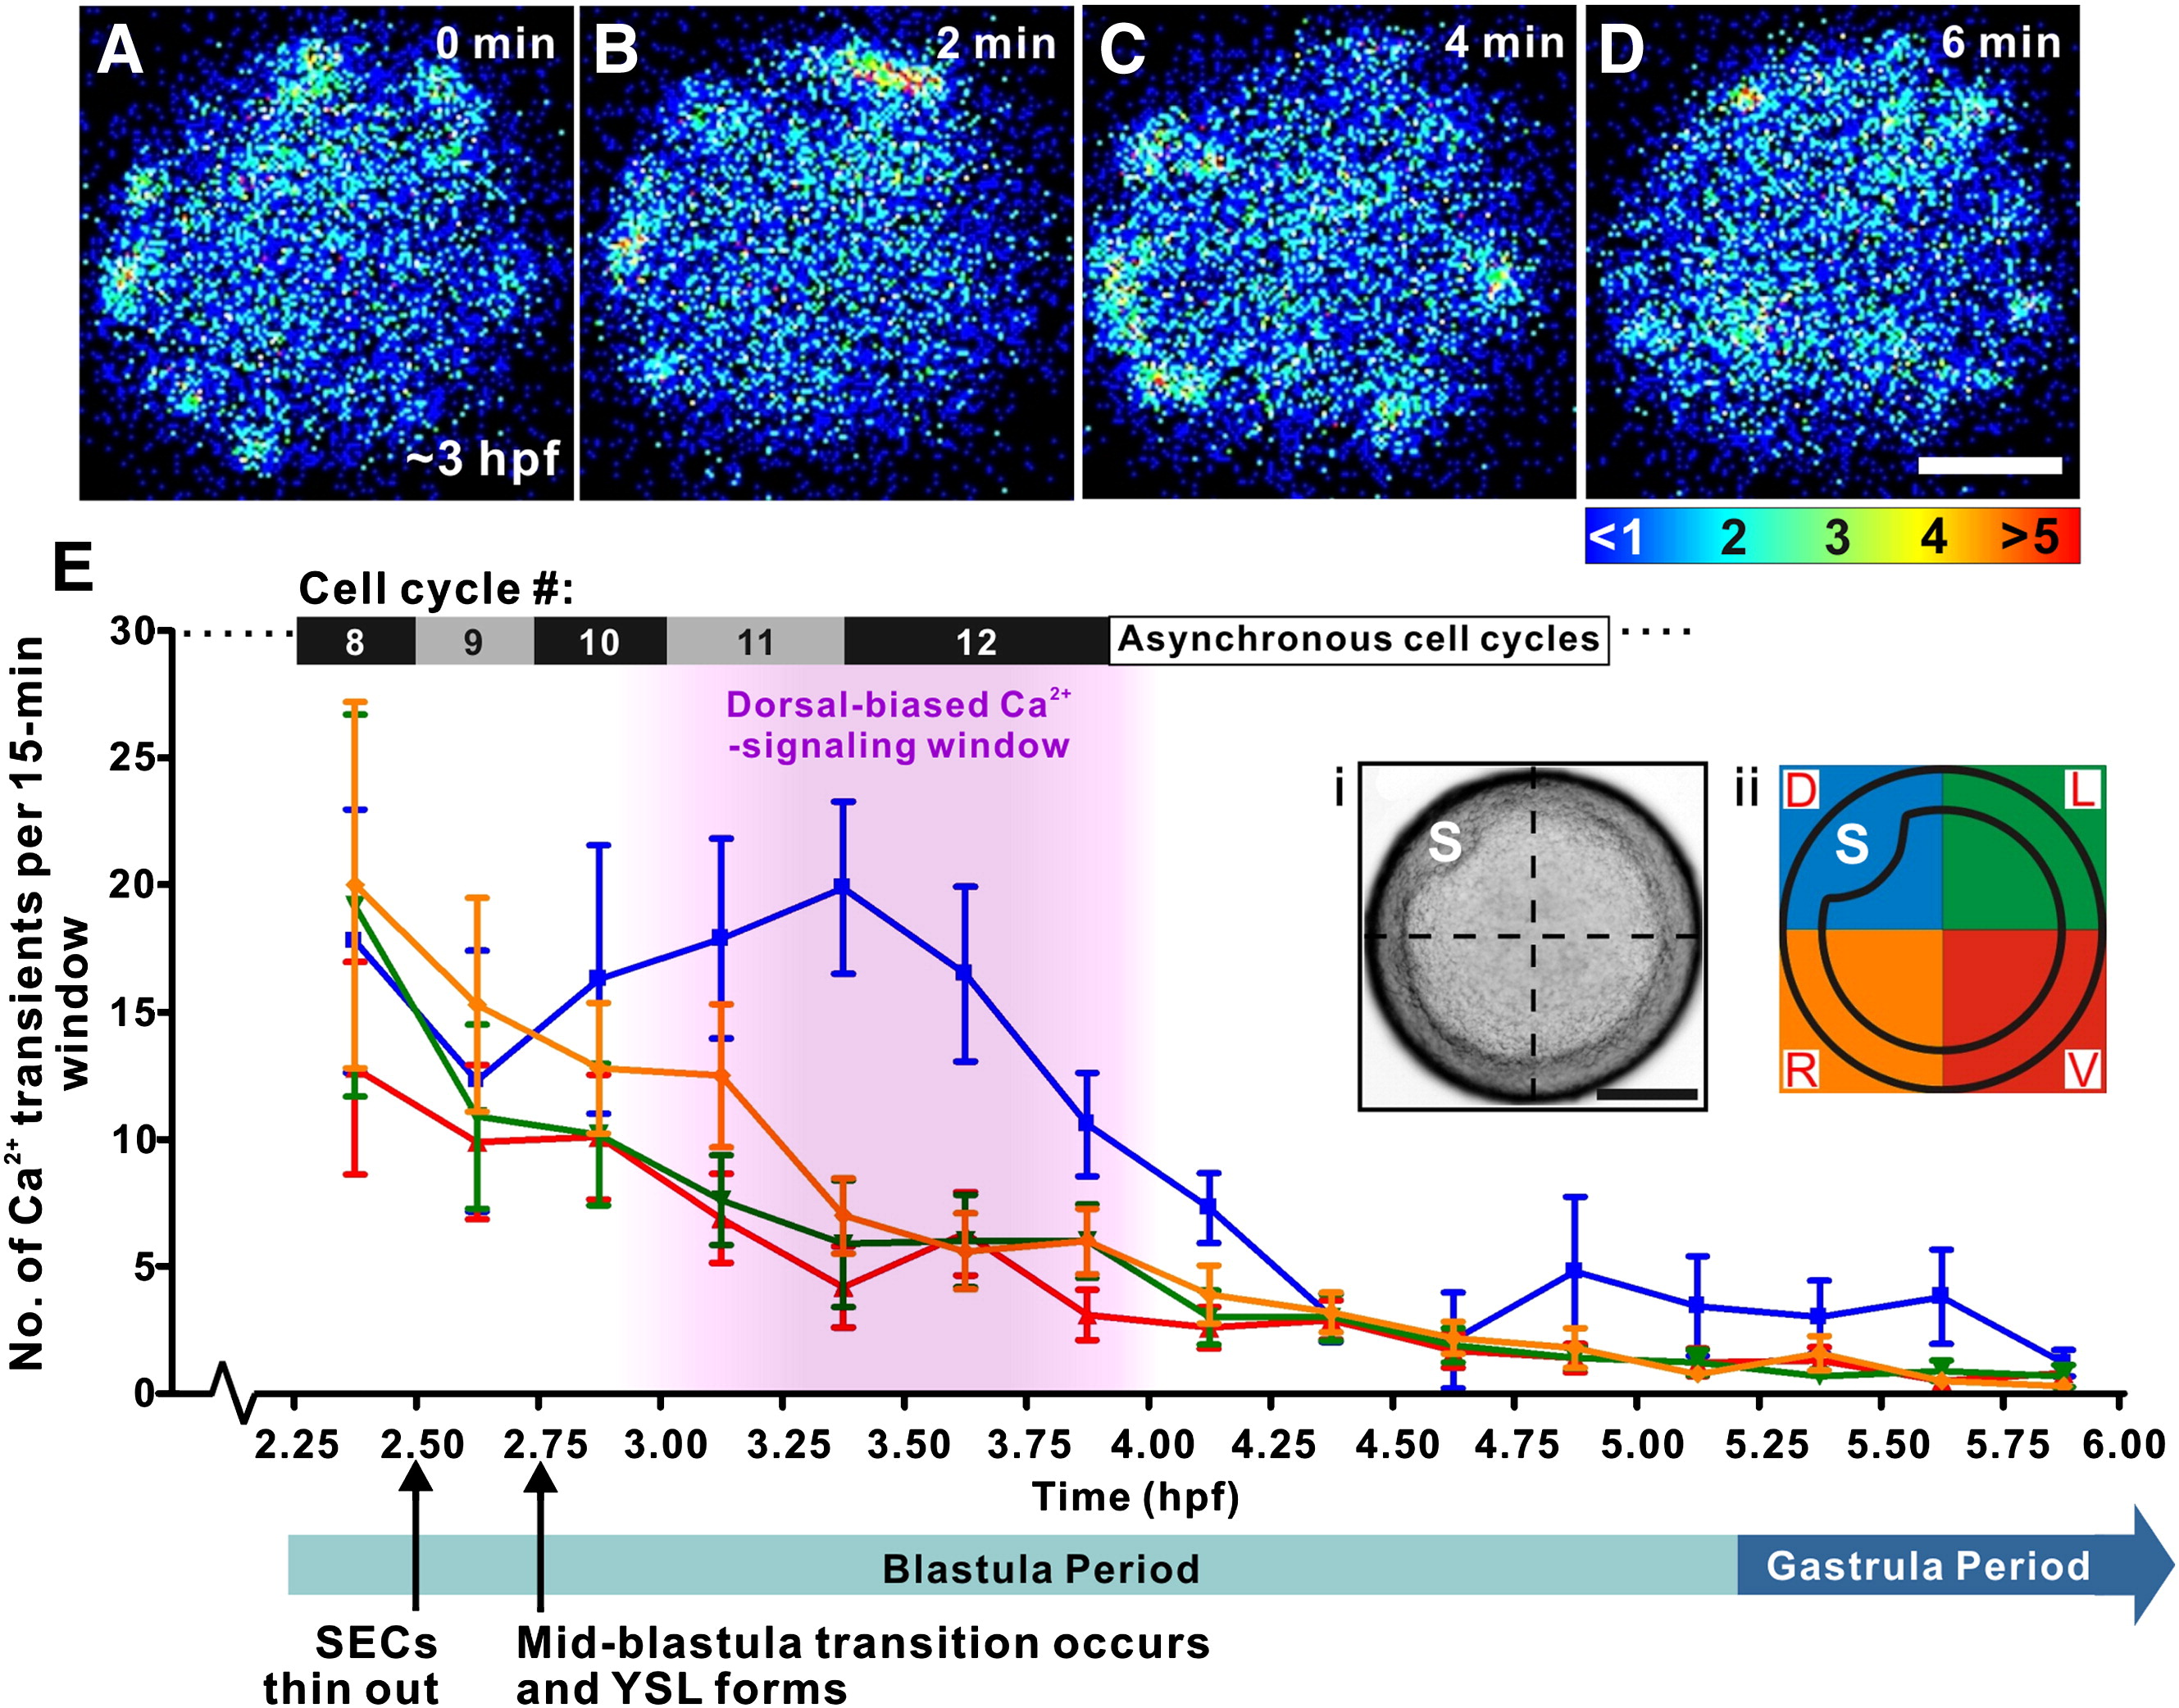
Fig. 3 Analysis of the spatial distribution of the Ca2+ transients visualized in zebrafish embryos during the Blastula Period and early Gastrula Period. (A–D) An example of the transients observed at ∼ 3 hpf in a representative embryo. Each pseudocolor panel represents 50 s of accumulated luminescence with a 70-second gap between each image. The color scale represents aequorin-generated luminescence in photons/pixel. (E) Line graph to show the distribution of the number of Ca2+ transients observed in fifteen 15-minute time windows in the dorsal (blue), ventral (red), left (green) and right (orange) quadrants of the blastoderm from 2.25–6 hpf (i.e., from the 128-cell stage to the shield stage). Data are expressed as means and SEMs from n = 10 intact embryos. The dorsal-biased Ca2+ signaling window, which runs from ∼ 3.0 to 4.0 hpf, is highlighted in pink. Information regarding the approximate duration of cell cycles 8–12 (Kane et al., 1992) and the duration of the Blastula and early Gastrula Periods (Kimmel et al., 1995) are also shown. (Ei) Bright-field image and (Eii) schematic diagram of a representative embryo, showing the embryonic shield (“S”) and quadrant division information such that D, V, L and R are dorsal, ventral, left and right, respectively. Scale bars = 200 μm.
Reprinted from Developmental Biology, 327(1), Ma, L.H., Webb, S.E., Chan, C.M., Zhang, J., and Miller, A.L., Establishment of a transitory dorsal-biased window of localized Ca(2+) signaling in the superficial epithelium following the mid-blastula transition in zebrafish embryos, 143-157, Copyright (2009) with permission from Elsevier. Full text @ Dev. Biol.

