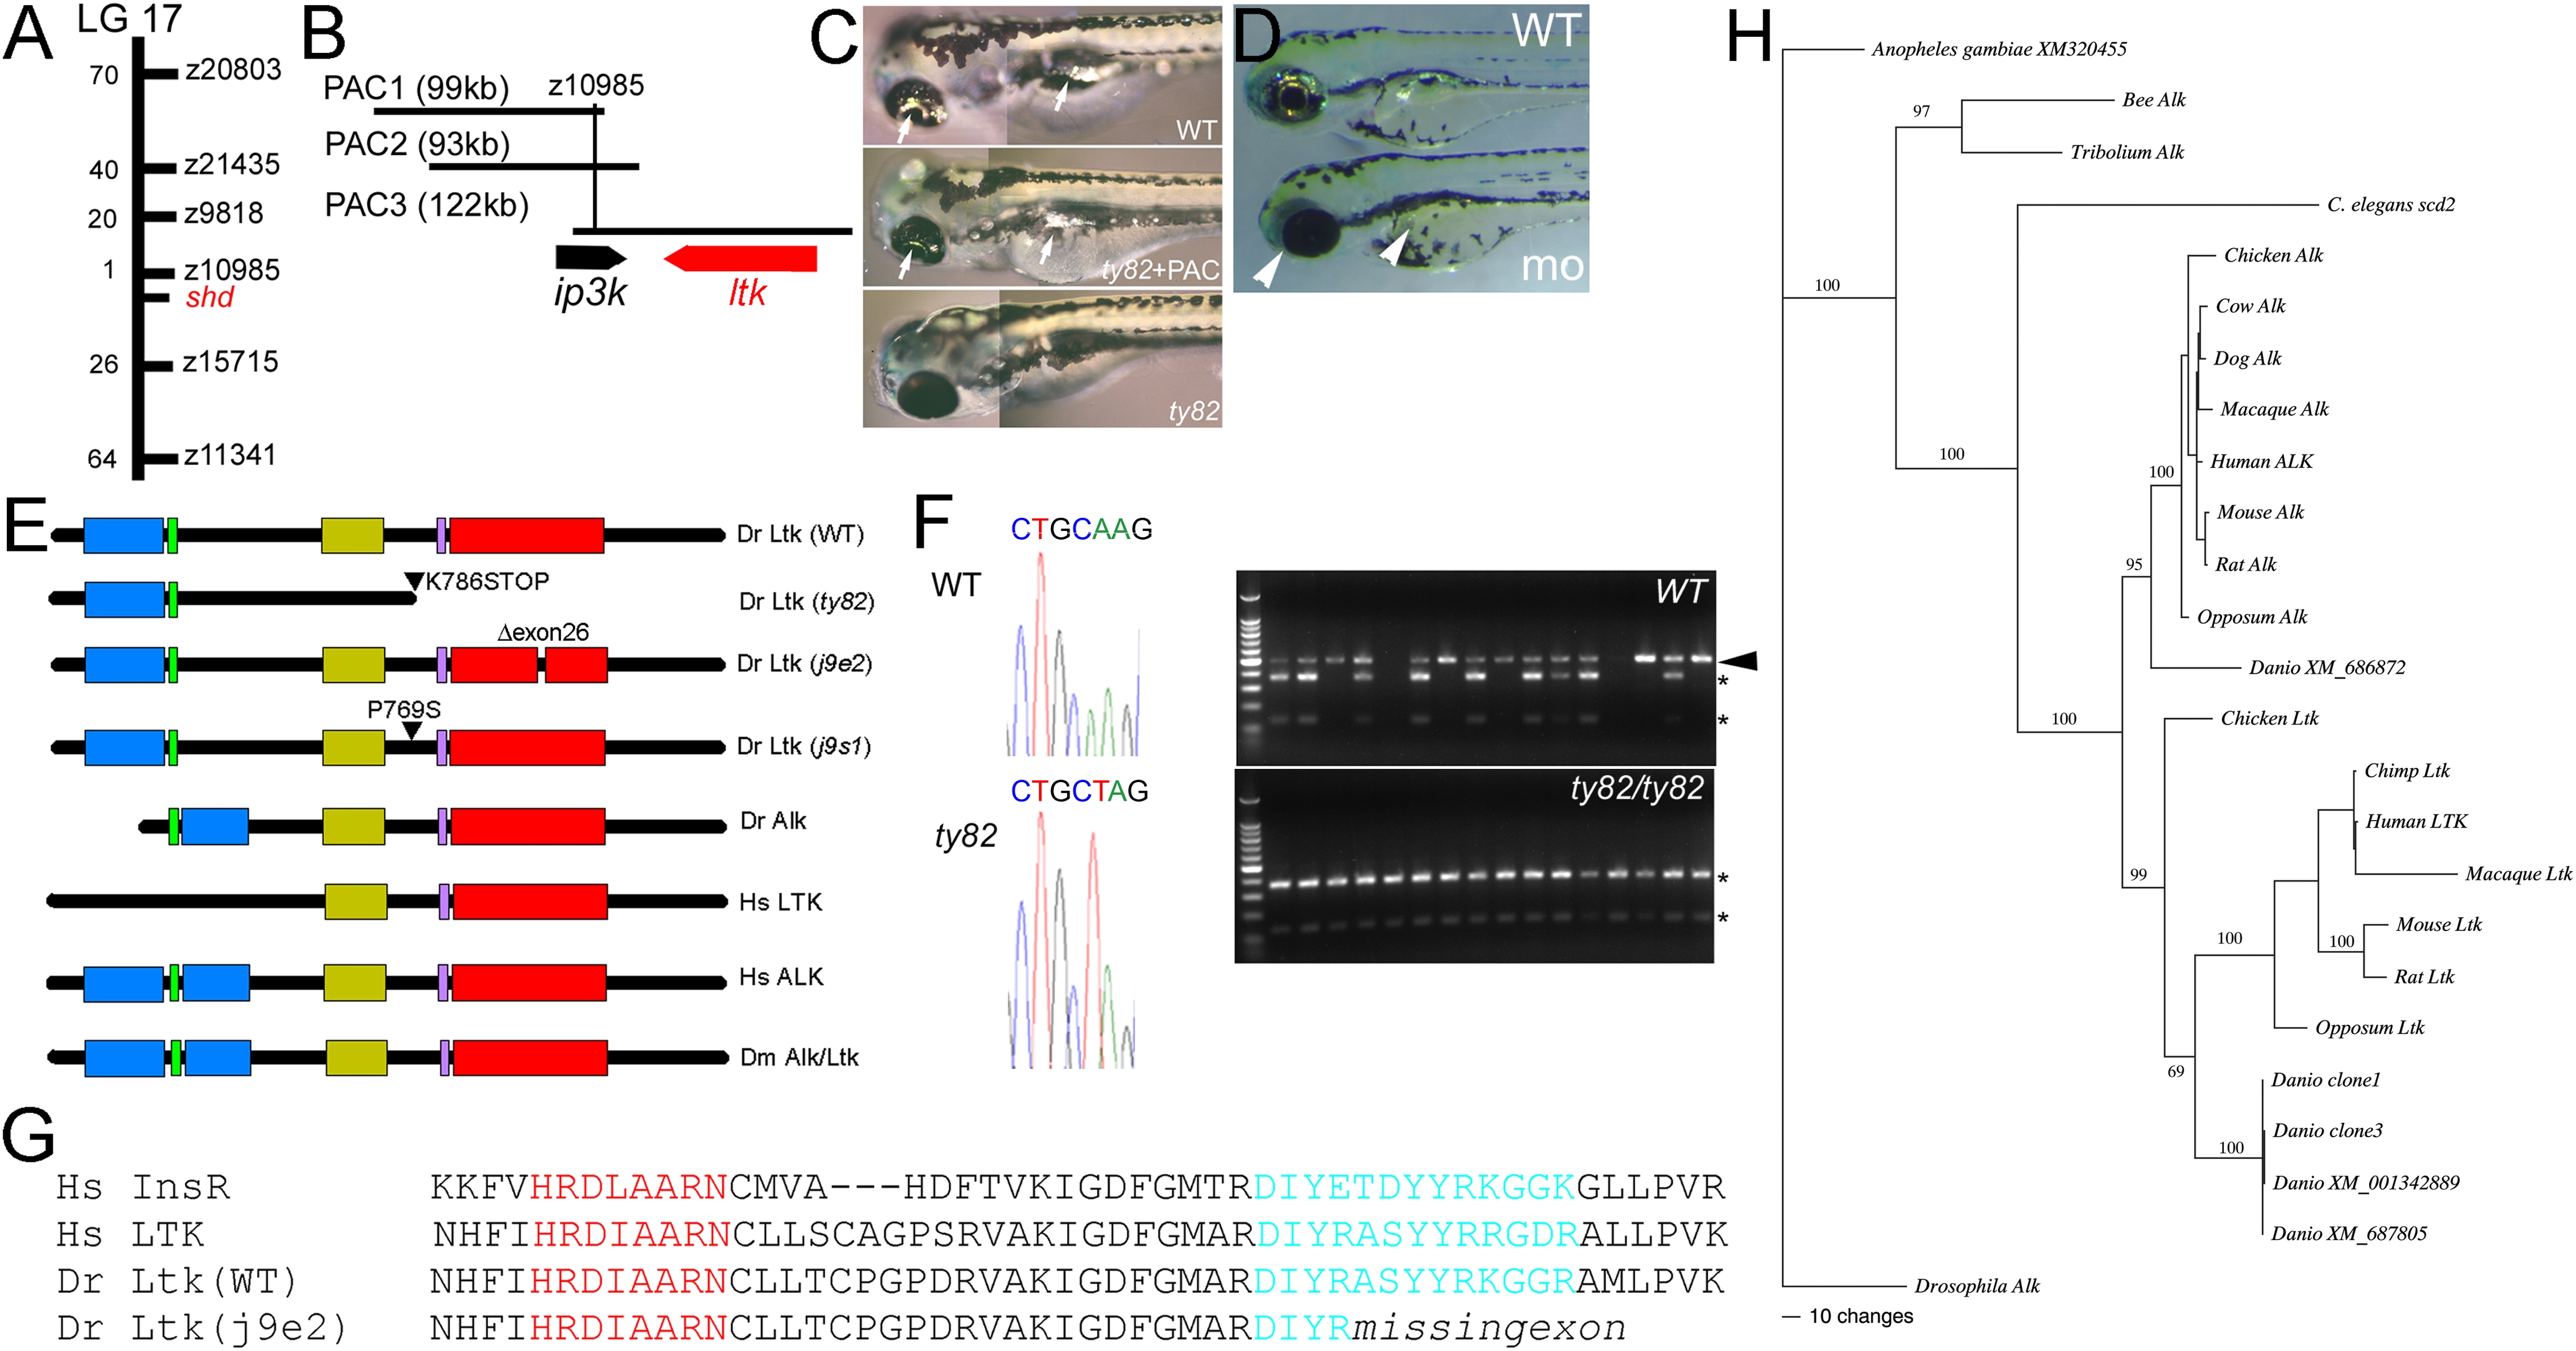
Fig. 2
shady mapping and identification as LTK orthologue.
A) shady (shd) map position on LG17; numbers of recombinants in 1000 shd mutant embryos between the marker and shd are given. B) PAC contig in shady region showing gene locations. C) Injection of PAC3 DNA (middle panel) rescues iridophore phenotype (arrows) of shdty82 mutants (no iridophores, lower panel) towards WT (upper panel). D) Injection of ltk morpholino into WT embryo generates shd mutant phenocopies (mo) with much-reduced iridophores (white arrowheads) compared with uninjected sibling (WT) or those injected with control morpholino (not shown). E) Schematics of predicted structures Alk and Ltk proteins in human (Hs), fruit fly (Dm) and zebrafish (Dr). Both WT and 3 mutant variants of the zebrafish are shown. Domains indicated are MAM (blue), LDLa (green), Gly-rich (gold), transmembrane (purple) and tyrosine kinase (red). Proteins are not shown to scale. F) Sequence traces show nucleotide substitution 2415A
Image
Figure Caption
Acknowledgments
This image is the copyrighted work of the attributed author or publisher, and
ZFIN has permission only to display this image to its users.
Additional permissions should be obtained from the applicable author or publisher of the image.
Full text @ PLoS Genet.

