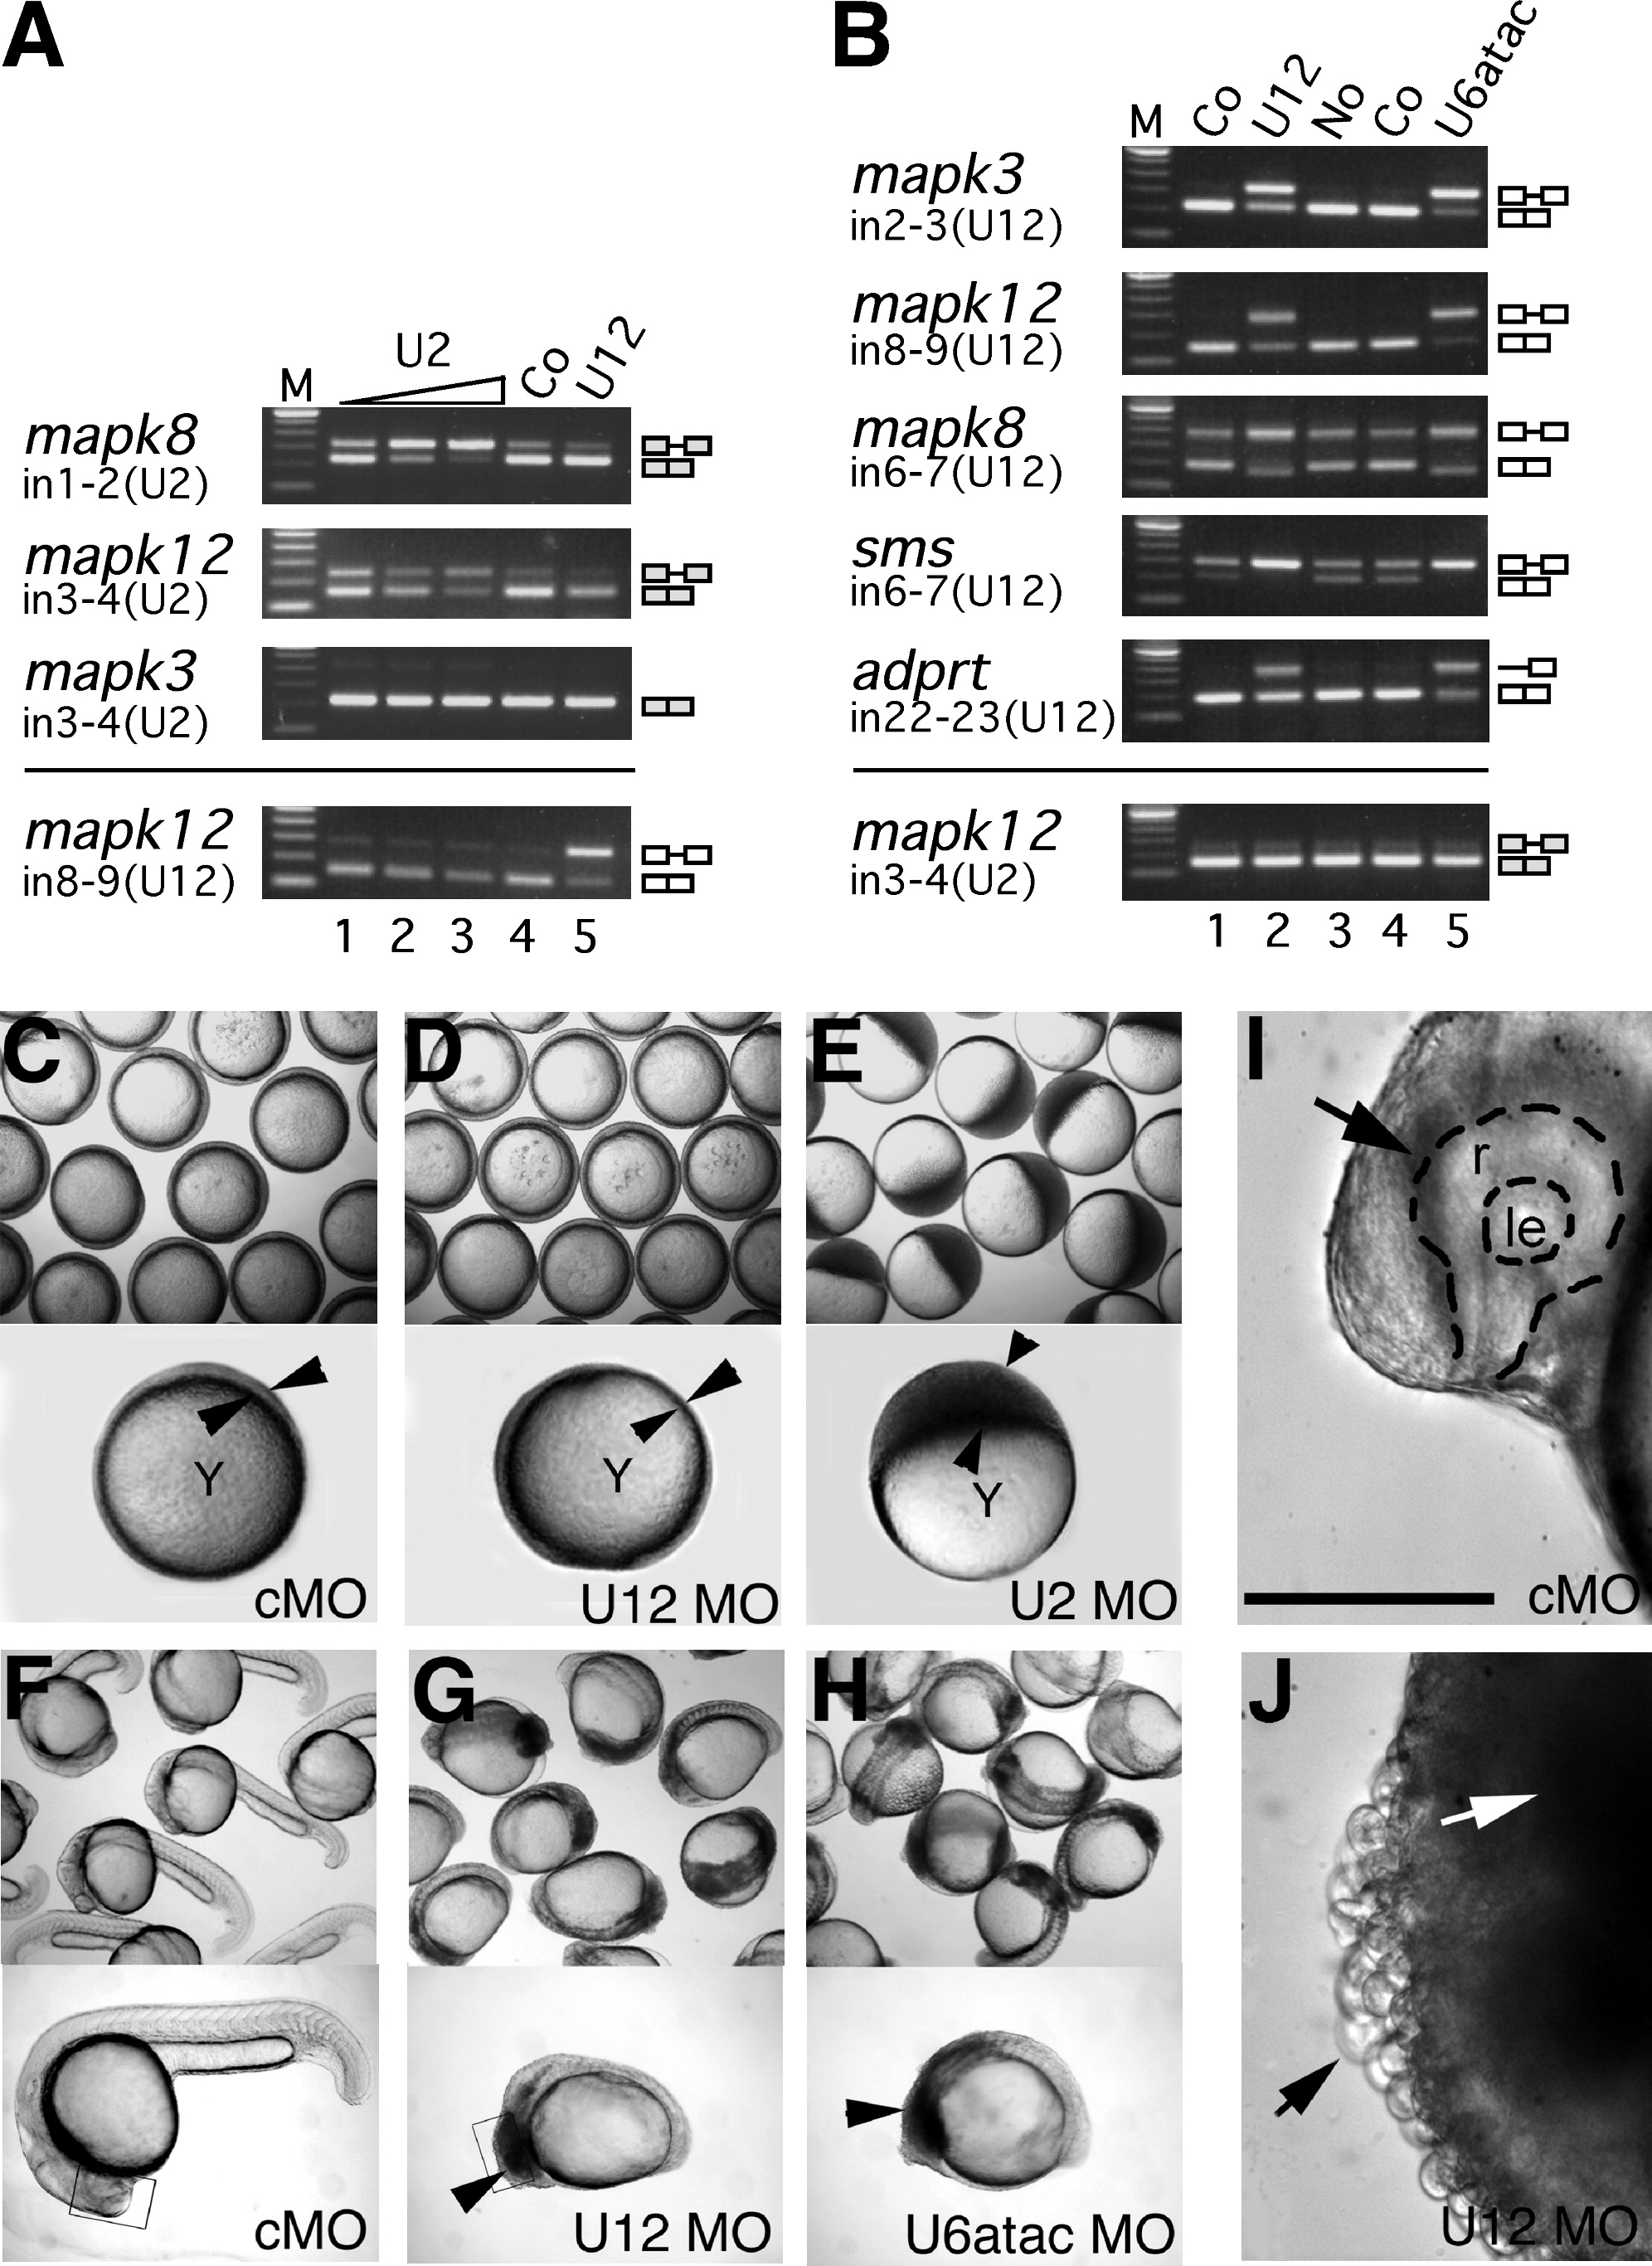
Fig. 4 Different Requirements for the Two Spliceosomes in Embryonic Development
(A and B) Inhibition of U2-type (A) and U12-type (B) splicing in zebrafish embryos upon injection of antisense morpholinos to snRNAs, analyzed by RT-PCR from RNA of different genes. mapk3 (erk1), mapk8 (jnk1), and mapk12 (sapk3), mitogen-activated kinases 3, 8, and 12, respectively; adprt, poly-ADP-ribosyl transferase; sms, spermine synthase. Embryos were either left uninjected (No) or were injected with control (Co) (standard control morpholino at 0.5 mM in [A]; mismatch morpholinos at 0.1 mM in [B]) or with antisense morpholinos to U2 (0.02, 0.1, and 0.5 mM), U12 (0.01 mM), or U6atac snRNA (0.1 mM). Total RNA was prepared from 30–40 embryos at 9 hpf (A) and 18 hpf (B). Removal of U2-type (U2) and U12-type (U12) introns (in) was analyzed by RT-PCR using primers hybridizing in the upstream and downstream exons, respectively. For adprt, an additional intronic forward primer was used. Splicing products are diagrammed on the right (exons, open boxes; introns, lines). M, 100 bp DNA ladder, lowest band is 100 bp.
(C–H) Embryo phenotypes upon injection of snRNA morpholino antisense oligonucleotides. Bright field views of groups (top) or representative individuals (bottom) of injected embryos are shown at the 75%–90% epiboly stage (C–E) or at 24 hpf (F–H). Epiboly movement is arrested in U2 morpholino-injected embryos (U2MO) as indicated by the accumulation of blastomeres on the top of the yolk cell (arrowheads in [E]) while the blastoderm (indicated by arrowheads in [C] and [D]) migrates normally around the yolk cell, Y, in standard control (cMO) or U12 morpholino (U12MO)-injected embryos. At 24 hpf, U12 and U6atac morpholino-injected (U6atacMO) embryos show a comparable, arrested phenotype indicated by dark cells spreading from anterior in the brain toward the somites (arrowheads in [G] and [H]) while cMO-injected embryos develop normally (F).
(I and J) Brain areas as depicted in rectangular frames in (F) and (G) are enlarged in (I) and (J). Arrow in (I) indicates the retina on the forebrain of a normally developing embryo. Dashed line indicates the outline of the retina (r) and the lens (le). Black arrow in (J) points at spherical cells losing cell-cell contact, white arrow indicates dark areas that contain cells that are rounding up and show an arrested phenotype on the equivalent anterior region of the embryo as shown in (I). Scale bar indicates 100 μm.
Reprinted from Cell, 131(4), König, H., Matter, N., Bader, R., Thiele, W., and Müller, F., Splicing Segregation: The Minor Spliceosome Acts outside the Nucleus and Controls Cell Proliferation, 718-729, Copyright (2007) with permission from Elsevier. Full text @ Cell

