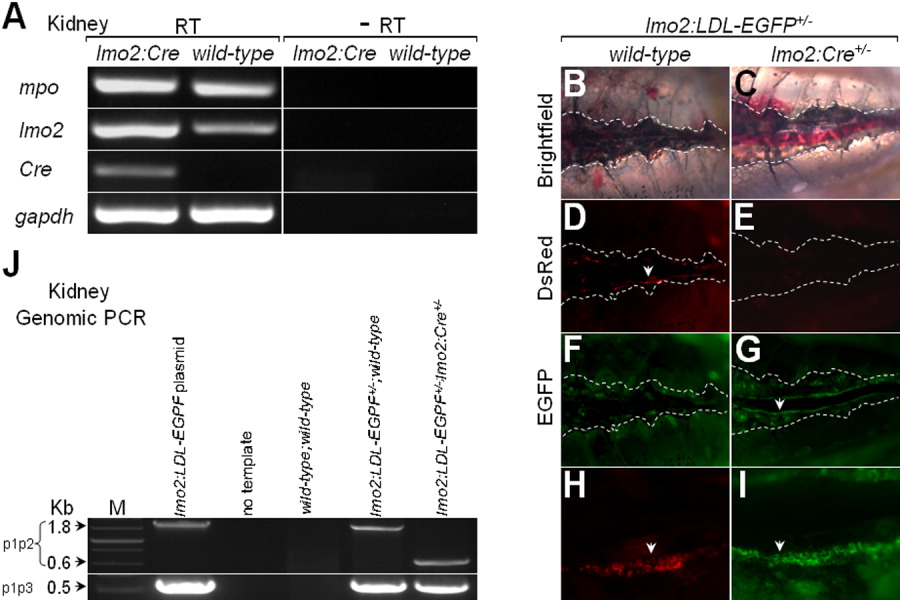
Fig. 7 Cre expression and activity in the kidney marrow of Tg(zlmo2:Cre) adult zebrafish. A: Detection of Cre expression by semi-quantitative RT-PCR. B-I: Cre activity in kidney marrow. The morphology of kidney marrows derived from lmo2:LDL-EGFP+/-;wild-type and lmo2:LDL-EGFP+/-;lmo2:Cre+/- fish is shown in B and C (dotted lines, head to the left). Detection of fluorescence in the kidney marrow of lmo2:LDL-EGFP+/-;wild-type (D and F), and lmo2:LDL-EGFP+/-;lmo2:Cre+/- fish (E and G). Amplified views of regions expressing red fluorescence (H) and green fluorescence (I), as shown in D and G, respectively. J: Detection of Cre-mediated recombination by genomic PCR in kidney marrow. Genomic PCR was performed using the same primer sets as shown in Figure 4A. The 0.6-kb recombinant fragment was amplified only from the kidney marrow of lmo2:LDL-EGFP+/-;lmo2:Cre+/- fish.
Image
Figure Caption
Acknowledgments
This image is the copyrighted work of the attributed author or publisher, and
ZFIN has permission only to display this image to its users.
Additional permissions should be obtained from the applicable author or publisher of the image.
Full text @ Dev. Dyn.

