Image
Figure Caption
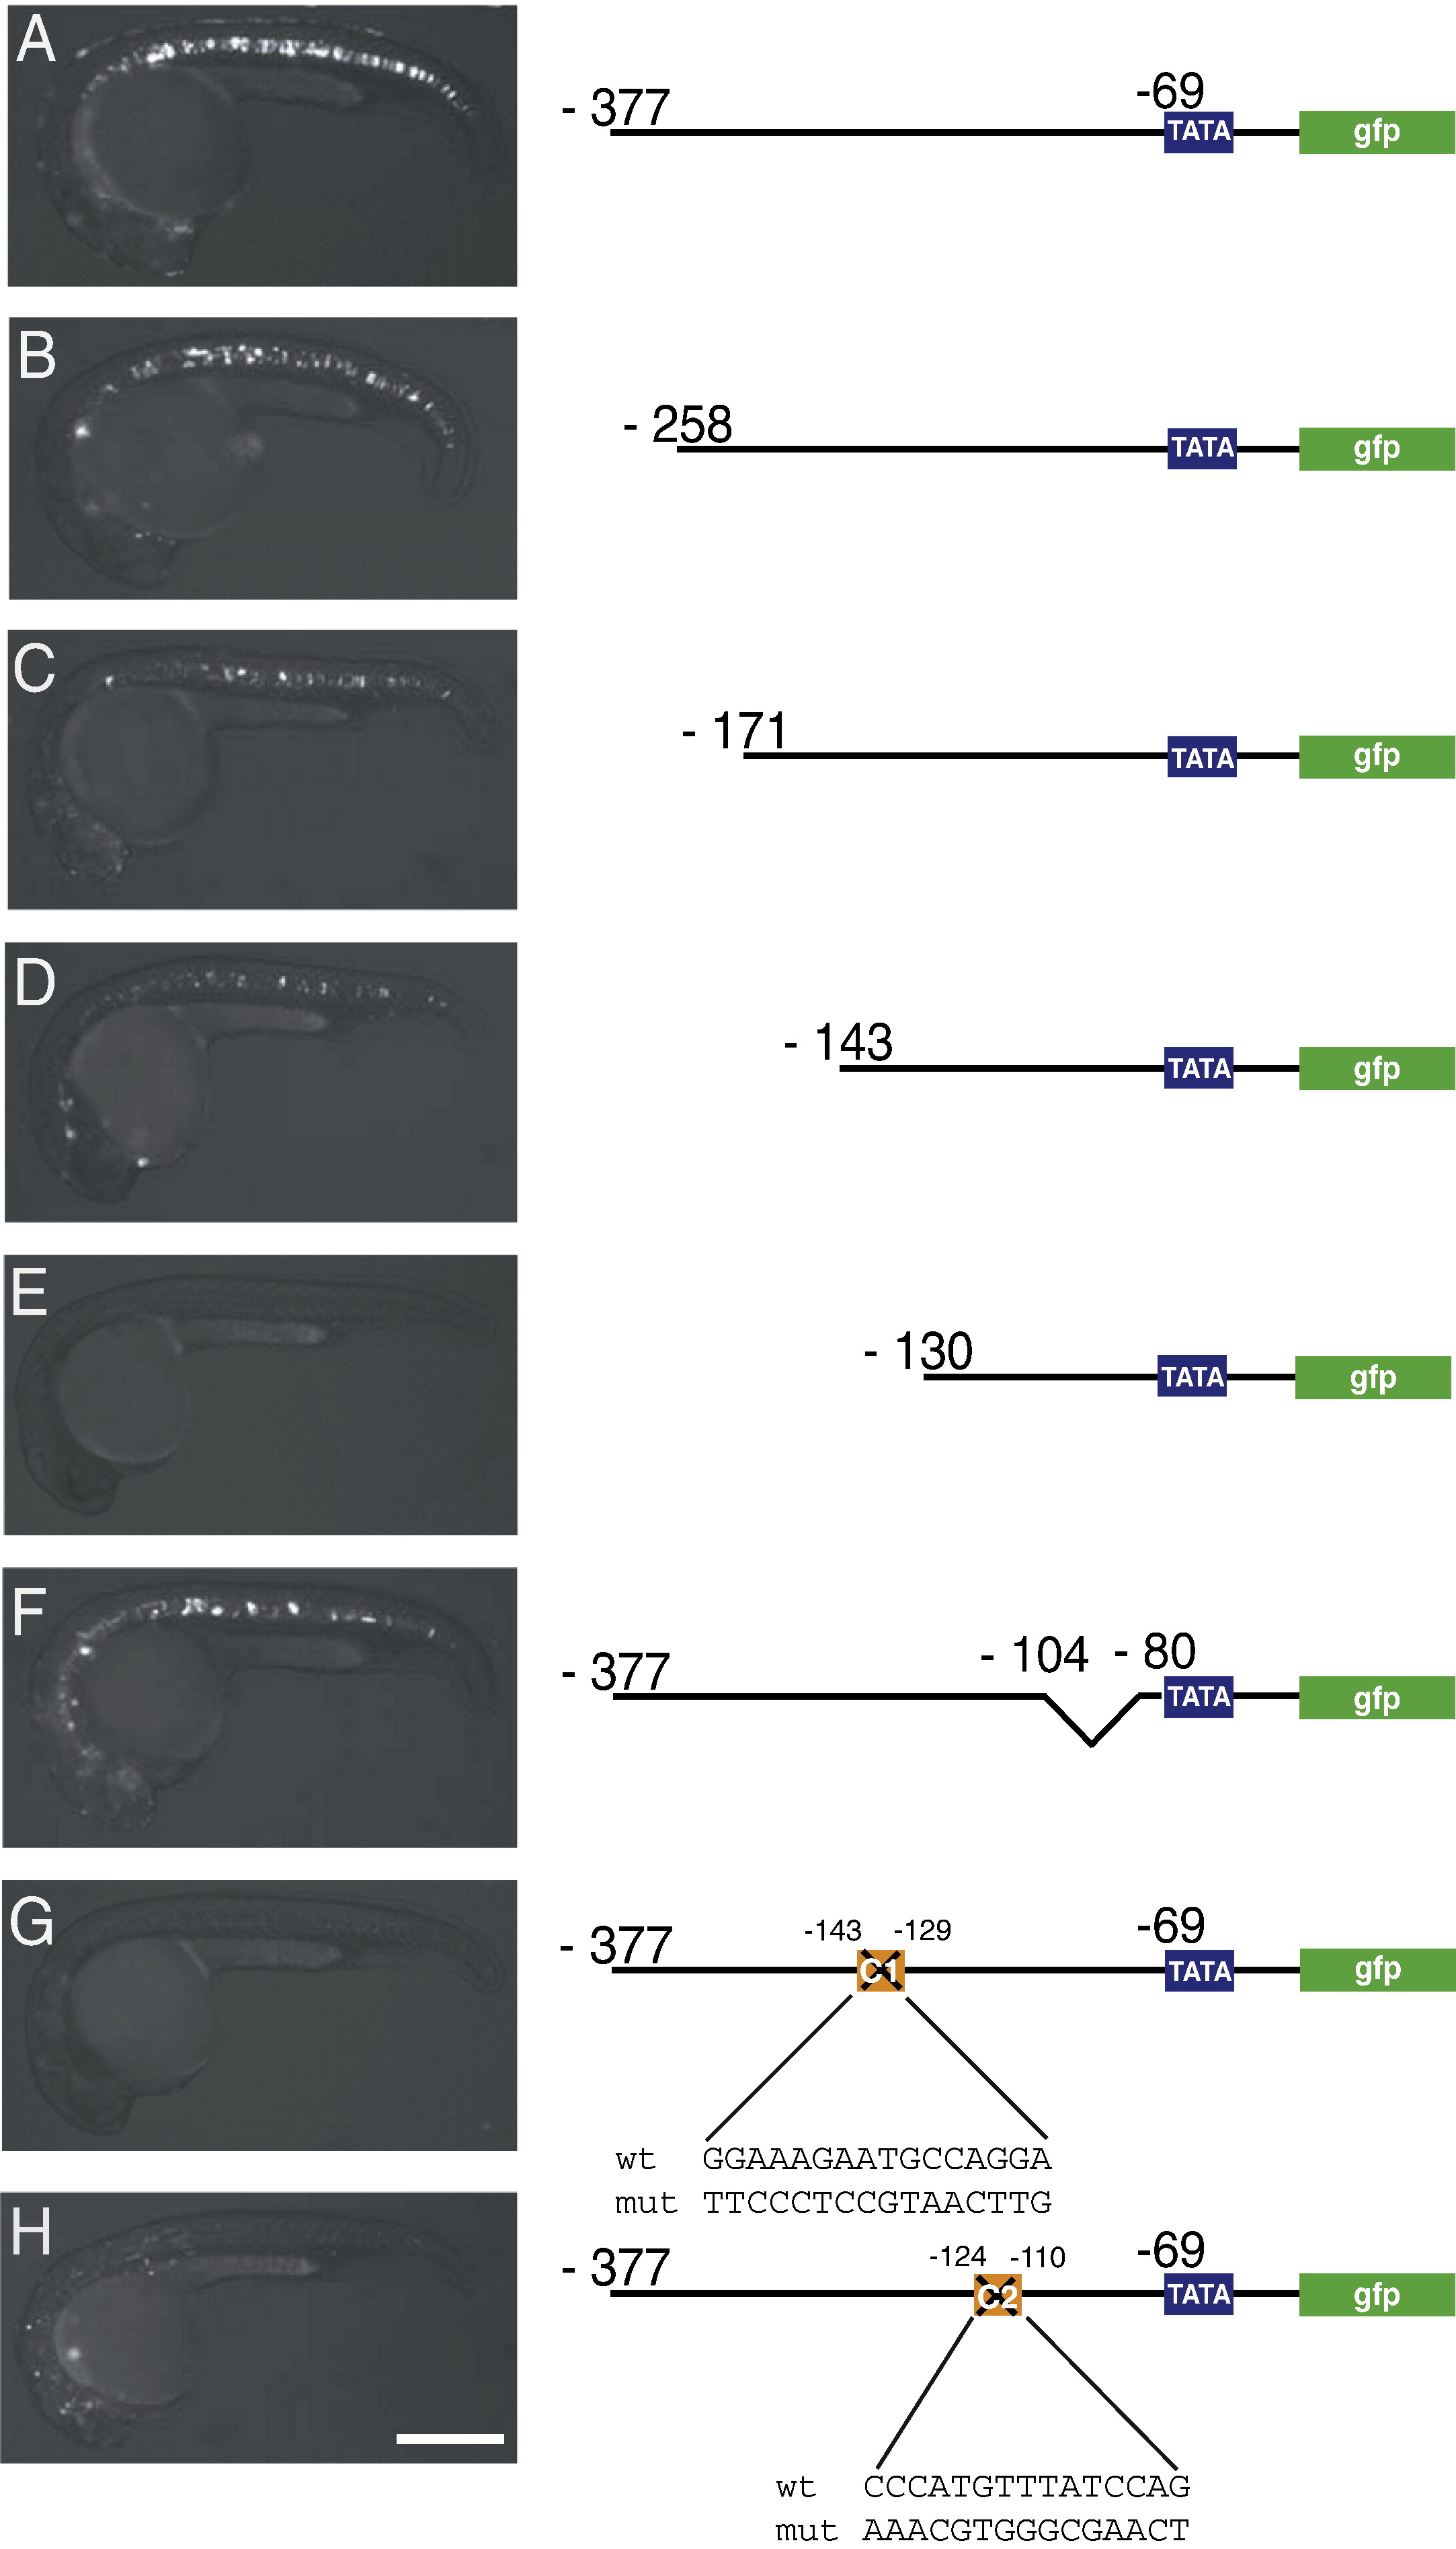
Fig. 3 Fine-mapping of the notochord regulatory sequences in ctgf up1. The left panels show gfp expression in the midline of 24 hpf zebrafish embryos. Right panels are schematic representations of the ctgf wild-type promoter (A) and mutant constructs (B to H) cloned upstream of the TATA-box of the ctgf gene and gfp-reporter cassette. Positions give base pairs upstream of the ATG. The transversions introduced to mutate the C1 and C2 elements are indicated. Embryos are anterior left and dorsal up. Scale bar = 250 μm.
Acknowledgments
This image is the copyrighted work of the attributed author or publisher, and
ZFIN has permission only to display this image to its users.
Additional permissions should be obtained from the applicable author or publisher of the image.
Reprinted from Developmental Biology, 318(2), Rastegar, S., Hess, I., Dickmeis, T., Nicod, J.C., Ertzer, R., Hadzhiev, Y., Thies, W.G., Scherer, G., and Strähle, U., The words of the regulatory code are arranged in a variable manner in highly conserved enhancers, 366-377, Copyright (2008) with permission from Elsevier. Full text @ Dev. Biol.

