
Fig. 2
|
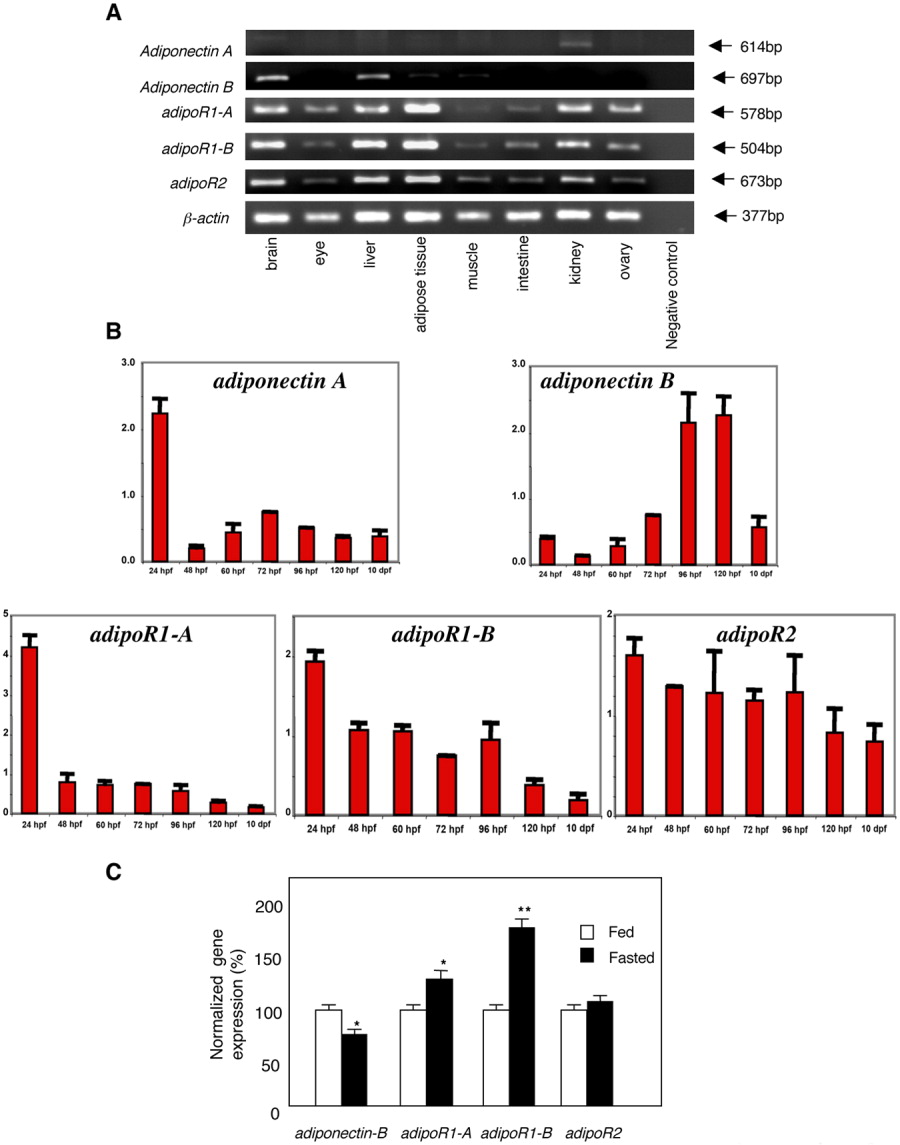
Fig. 2 Expression in adult tissues in wild type and fasted fish. A: Semi-quantitative RT-PCR analysis of adiponectin and adipoR genes in various adult tissues. PCR bands were visualized on 1.5% agarose gel stained with ethidium bromide. The PCR amplicons were of expected size, Their sizes are indicated on the right. B: Level of expression of adiponectin and adiponectin receptor genes during zebrafish development. Normalizations of the Q-PCR were done using the 18s gene. Note that all genes are expressed as early as 24 hpf and remain expressed up to 10 dpf. Developmental stages prior 24 hpf were not monitored. C: Q-PCR study of the effects of 96-hr fasting on the expression of the adiponectin and adipoR genes in adult liver. The amount of adiponectin or adipoR mRNA relative to β-actin mRNA is indicated after a normalization at 100% for the fed condition. The data represent mean ± SEM values from three adult zebrafish for each tissue. The stars indicate groups that differ significantly (t-test).