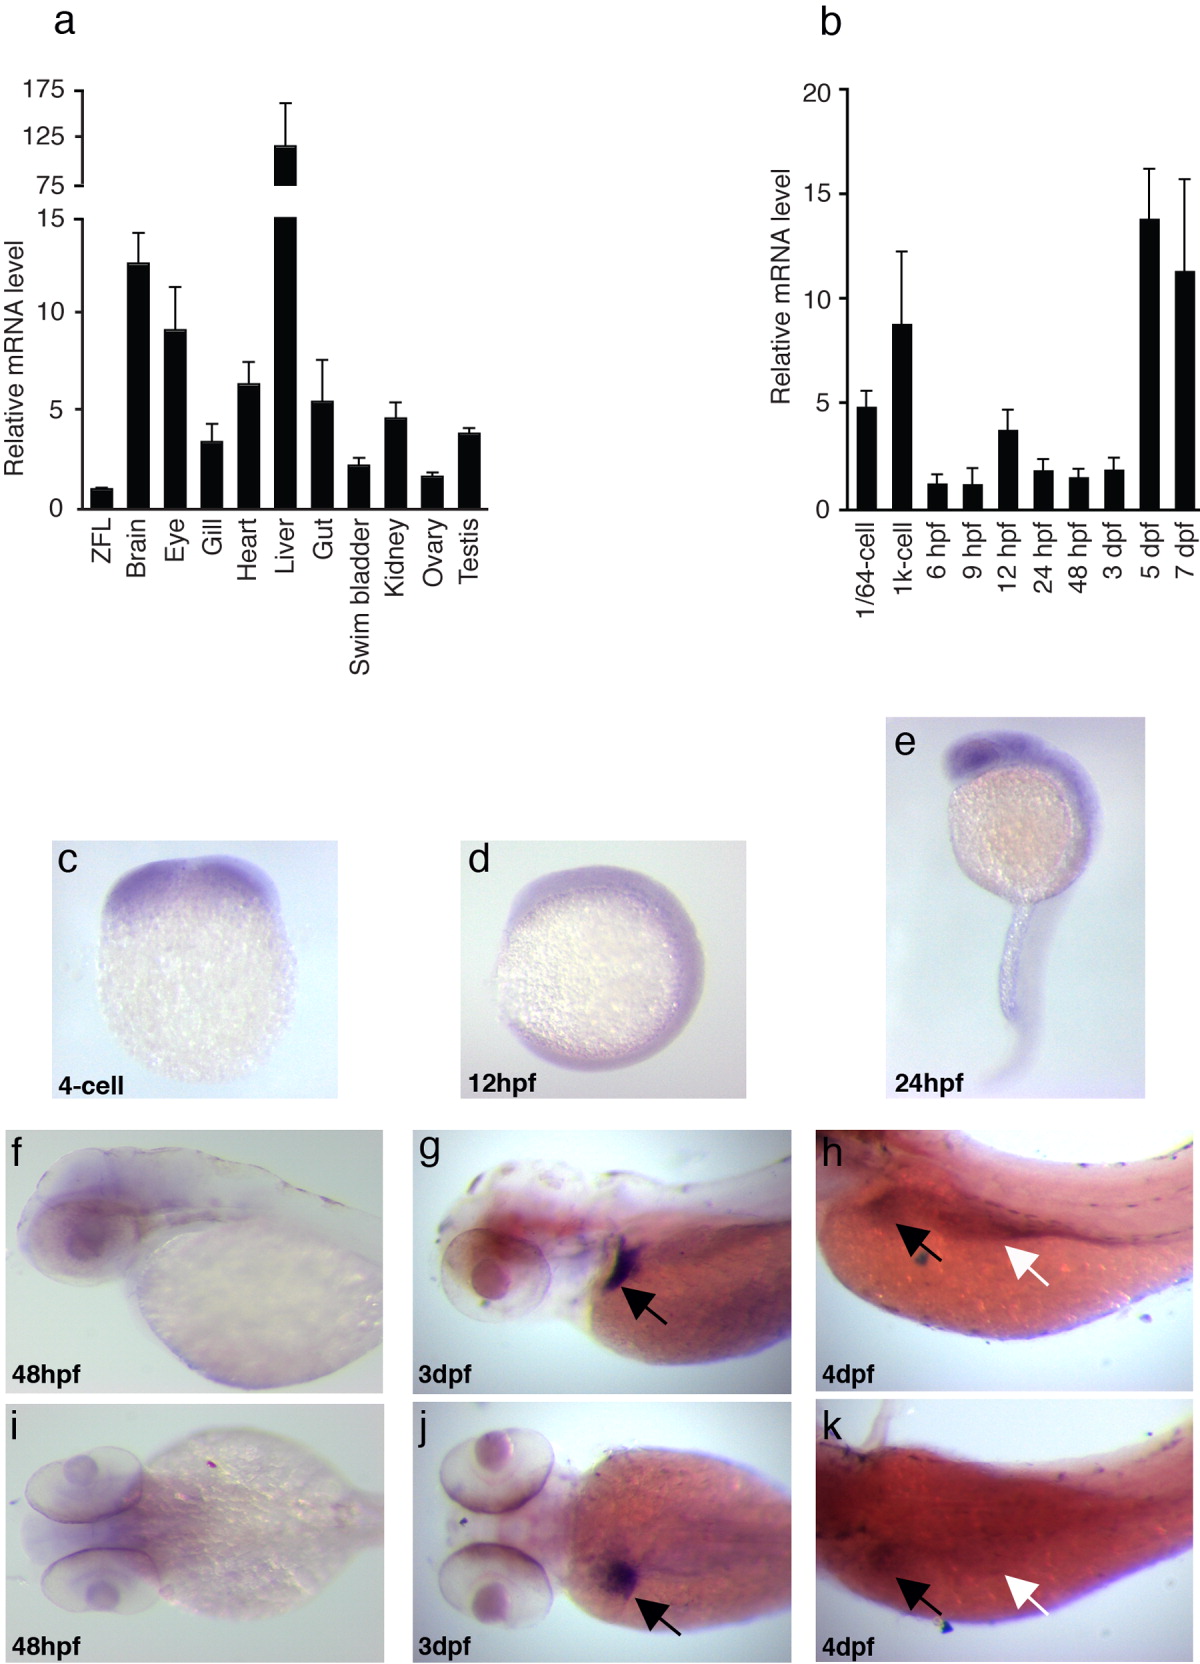
Fig. 5 Tissue distribution and developmental expression pattern of lxr mRNA in zebrafish. a: RNA samples from adult zebrafish tissues were analyzed by qPCR. lxr expression was normalized to β-actin with the level of expression in ZFL cells set to 1. Values are the mean + SEM of three independent pools of organs from 5-10 adult zebrafish. b: Temporal pattern of lxr mRNA expression was analyzed by qPCR in 1/64-cell to 7-dpf embryos. The level of expression was normalized to β-actin and values are the mean + SEM of three independent pools of embryos. c-k: Spatial expression pattern of lxr was visualized by whole mount in situ hybridization. Lateral view: dorsal up and anterior to the left (c-h). Dorsal view (i-k). Black arrows indicate the liver (g,h,j,k) and white arrows indicate the intestine (h,k).
Image
Figure Caption
Figure Data
Acknowledgments
This image is the copyrighted work of the attributed author or publisher, and
ZFIN has permission only to display this image to its users.
Additional permissions should be obtained from the applicable author or publisher of the image.
Full text @ Dev. Dyn.

