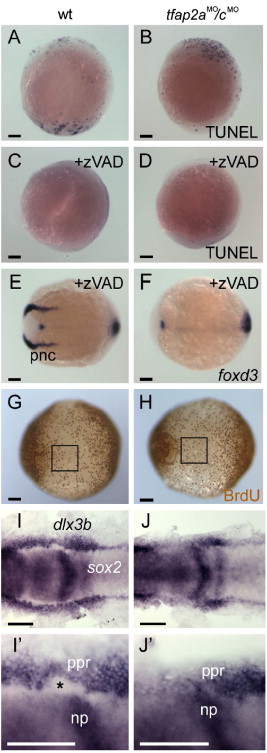
Fig. 8 Loss of neural crest in tfap2a/c deficient embryos is concomitant with an expansion of neural plate. (A–D) Lateral views, dorsal to the right, of either uninjected wild-type or tfap2aMO/cMO embryos fixed at 11 hpf and processed to reveal dying cells with TUNEL. A wild-type embryo and a tfap2aMO/cMO embryo have comparable numbers of TUNEL-positive cells [control embryos, 62 ± 70 (average ± standard deviation), n = 13; tfap2aMO/cMO embryos, 42 ± 38, n = 28; unpaired t test, p = 0.23]. (C) A wild-type embryo, and (D) a tfap2aMO/cMO embryo, after treatment with caspase inhibitor zVAD-fmk. Reduced levels of cell death are seen in both of them (control embryos, 10 ± 14, n = 19, p < 0.005 in comparison to untreated controls; tfap2aMO/cMO embryos, 17 ± 13, n = 18, p < 0.05, in comparison to untreated tfap2aMO/cMO embryos). Dorsal views, anterior to the left, of panel E, a wild-type embryo, and panel F, a tfap2aMO/cMO embryo treated with zVAD-fmk and processed to reveal foxd3 expression at 11 hpf. foxd3 expression is absent in the premigratory neural crest (pnc) domain of the zVAD treated tfap2aMO/cMO embryo (30 of 30 zVAD treated tfap2aMO/cMO embryos). (G, H) Ventral views, anterior to the left, of embryos incubated in BrdU for 20 min at 10 hpf, fixed at 11 hpf, and stained for anti-BrdU IR. The number of anti-BrdU IR positive cells within a 200 x 200 μm region of ventral ectoderm (boxes in panels G and H) was comparable in both groups (control embryos, 37 ± 6 anti-BrdU IR positive cells, n = 9 embryos; tfap2aMO/cMO embryos, 35 ± 7 anti-BrdU IR positive cells, n = 9 embryos; unpaired t test, p = 0.48). (I, J) Dorsal views of 11 hpf embryos processed to reveal sox2 expression, labeling neural plate (np), and dlx3b expression, labeling the pre-placodal region (ppr). (I′, J′) Close-up views of right side of embryos shown in panels I and J, respectively. The space between these two expression domains, normally occupied by premigratory neural crest (asterisk in panel I2), is absent in the tfap2aMO/cMO embryo (J, 30 of 32 tfap2aMO/cMO embryos). Scale bars: (A–J), 100 μm; (I′, J′), 50 μm.
Reprinted from Developmental Biology, 304(1), Li, W., and Cornell, R.A., Redundant activities of Tfap2a and Tfap2c are required for neural crest induction and development of other non-neural ectoderm derivatives in zebrafish embryos, 338-354, Copyright (2007) with permission from Elsevier. Full text @ Dev. Biol.

