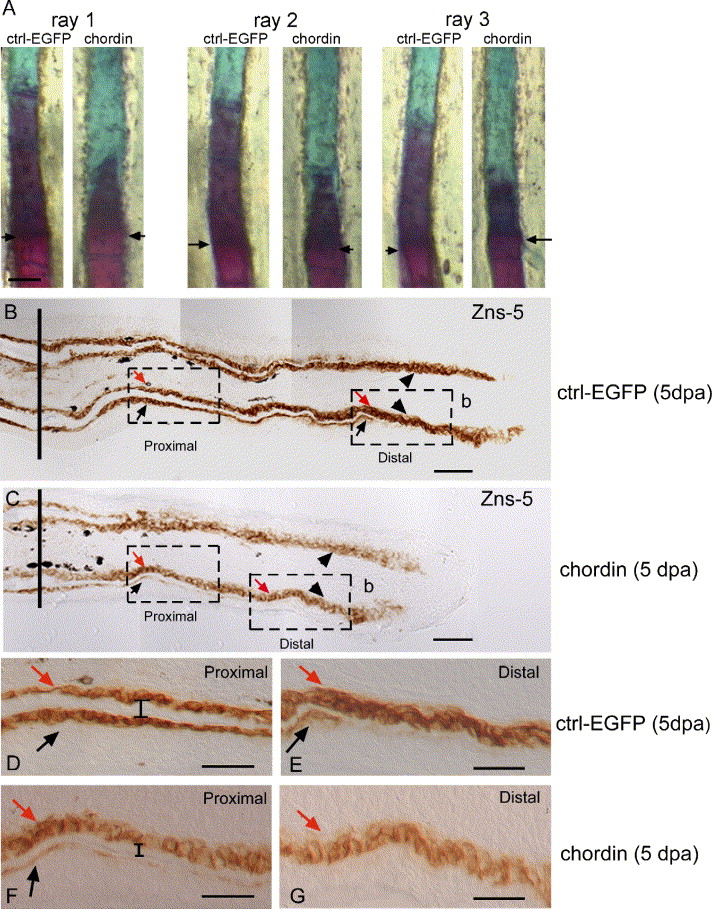
Fig. 4 Morphology of the fin rays following chordin injection. Comparison of the ossification progression using Alizarin red staining in rays 1, 2 and 3 of the EGFP and chordin-injected lobes at 9 dpa/6 dpi shows a reduction of matrix mineralization in chordin-injected rays. (B-G) Immunodetection of the scleroblasts using the Zns-5 scleroblast-specific antibody on longitudinal sections of fin regenerates at 5 dpa, 2 days after injection of EGFP (B, D, E) and of chordin (C, F, G). (B) In the control rays at 5 dpa, newly differentiating scleroblasts (arrowheads) in the distal region (dashed box on the right side of the panel) are located on the internal surface of the bone matrix while more mature bone secreting cells are found on the internal (red arrow) and external (black arrows) surfaces of the proximal lepidotrichia (dashed box on the left side of the panel). (C) chordin-injected regenerate at 5 dpa shows fewer mature scleroblasts on the external surface of the proximal lepidotrichia (black arrow) and is shorter in length compared to the control regenerate. (D-G) Higher magnification of the dashed boxes shown in panels B and C; (D, E) proximal and distal regions, respectively, of the control EGFP-injected rays and (F, G) proximal and distal regions, respectively, of the chordin-injected rays. Note the reduced number of mature scleroblasts on the external surface of the proximal part of the lepidotrichia (F) when compared to the control ray (D); the flattened shape of the scleroblasts on the internal and external surfaces of the lepidotrichia only observed in the proximal part of the regenerate of the control EGFP-injected rays; the reduced bone thickness observed in the proximal part of the regenerate of chordin-injected rays (F) when compared to the corresponding region of the control ray (D) as indicated by the bars [I]; and the absence of bone matrix in the distal part of the chordin-injected rays (G) compared to the corresponding region in the control ray (E). Arrows in panel A and solid lines in panels B and C indicate the level of amputation. Arrowheads in panels B and C indicate newly differentiating scleroblasts L, lepidotrichia; s, scleroblasts; b: blastema. Distal part of the regenerate is to the top (A) and to the right (B-G). Scale bars: (A) = 100 μm, (B, C) = 25μm, (D-G) = 50 μm.
Reprinted from Developmental Biology, 299(2), Smith, A., Avaron, F., Guay, D., Padhi, B.K., and Akimenko, M.A., Inhibition of BMP signaling during zebrafish fin regeneration disrupts fin growth and scleroblast differentiation and function, 438-454, Copyright (2006) with permission from Elsevier. Full text @ Dev. Biol.

