Fig. 4
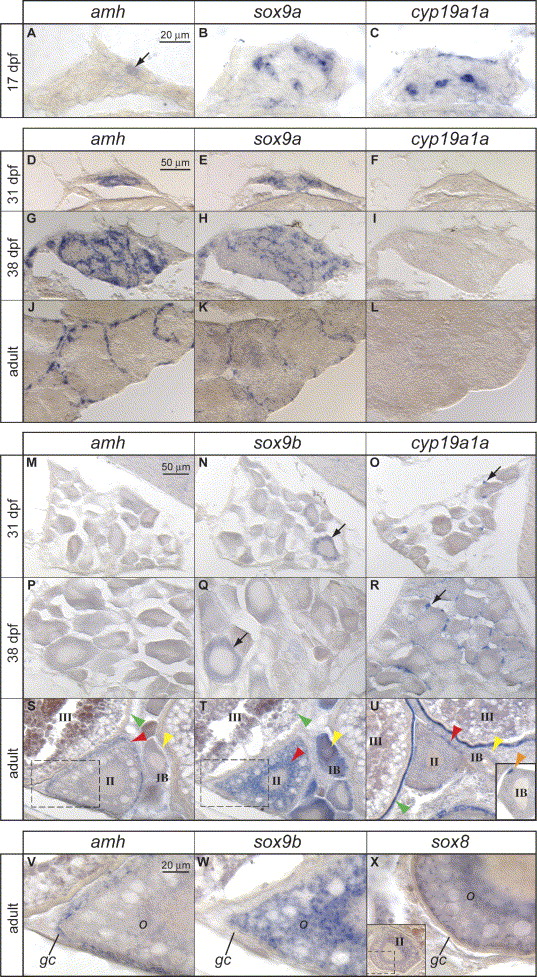
Fig. 4 Comparative analysis of the expression pattern of amh, sox9a, sox9b, cyp19a1a and sox8 during zebrafish gonad development. (A–C) undifferentiated gonads; (D–L) male gonads; (M–X) female gonads. To facilitate comparison among the expression patterns of amh (A,D,G,J,M,P,S,V), sox9a (B,E,H,K), sox9b (N,Q,T,W), cyp19a1a (C,F,I,L,O,R,U), and sox8 (X), in situ hybridization experiments were performed on adjacent sections. (A–C) The undifferentiated gonads of 17 day dpf larvae showed amh expression at low levels but already showed high expression of sox9a and cyp19a1a. (D–F) In 31 dpf juveniles, gonads had already differentiated. At this time in males, expression of amh and sox9a, but no cyp19a1a, was detected in testes. (G–L) As development of the gonads proceeded, the same expression pattern as in 31 dpf was maintained in later juvenile stages and adults, in which amh and sox9a expression could be observed in presumptive Sertoli cells, and cyp19a1a expression was not detected. (M–R) In gonads of 31 and 38 dpf female juveniles, no amh expression could be detected (M,P), sox9b was expressed at low levels in the ooplasm of some oocytes (N,Q) and cyp19a1a was expressed in cells surrounding the oocytes (O,R). (S–U) In adult female ovaries, amh expression was detected in granulosa cells of stage II oocytes (red arrowhead in S), but no expression was detected in early stage IB oocytes (yellow arrowhead in S) or late stage III oocytes (green arrowhead in S). Expression of sox9b was detected in the ooplasm of stage IB oocytes (yellow arrowhead in T) and stage II oocytes (red arrowhead in T) but no expression was detected in late stage III oocytes (green arrowhead in T). Regions in dashed boxes in (S) and (T) are shown in higher magnification in (V) and (W), respectively. Expression of cyp19a1a was not detected in early stage IB oocytes (yellow arrowhead in U), some granulosa cells were expressing cyp19a1a in late stage IB oocytes (orange arrowhead in U), most of the granulosa cells expressed cyp19a1a in stage II oocytes (red arrowhead in U), and maximum cyp19a1a expression was observed in late stage III oocytes (green arrowhead in U). (V–X) Comparison of amh, sox9b and sox8 expressions in stage II oocytes revealed that while amh was expressed in granulosa cells (gc) (V), sox9b and sox8 were expressed in the ooplasm (o) of oocytes (W,X). The main image in (X) is an enlargement of the boxed region of the inset, which shows a lower magnification of a complete view of a stage II oocyte. Roman numbers and letters indicate the stage of the oocytes according to (Selman et al., 1993). Scale bars: 20 μm (A–C as in A), 50 μm (D–L as in D), 50 μm (M–U as in M), 20 μm (V–X as in V). Colored arrowheads label different stages of oocytes: yellow, early stage IB; orange, late stage IB; red, stage II; green, late stage III.
Reprinted from Gene expression patterns : GEP, 5(5), Rodríguez-Marí, A., Yan, Y.L., Bremiller, R.A., Wilson, C., Cañestro, C., and Postlethwait, J.H., Characterization and expression pattern of zebrafish anti-Müllerian hormone (amh) relative to sox9a, sox9b, and cyp19a1a, during gonad development, 655-667, Copyright (2005) with permission from Elsevier. Full text @ Gene Expr. Patterns

