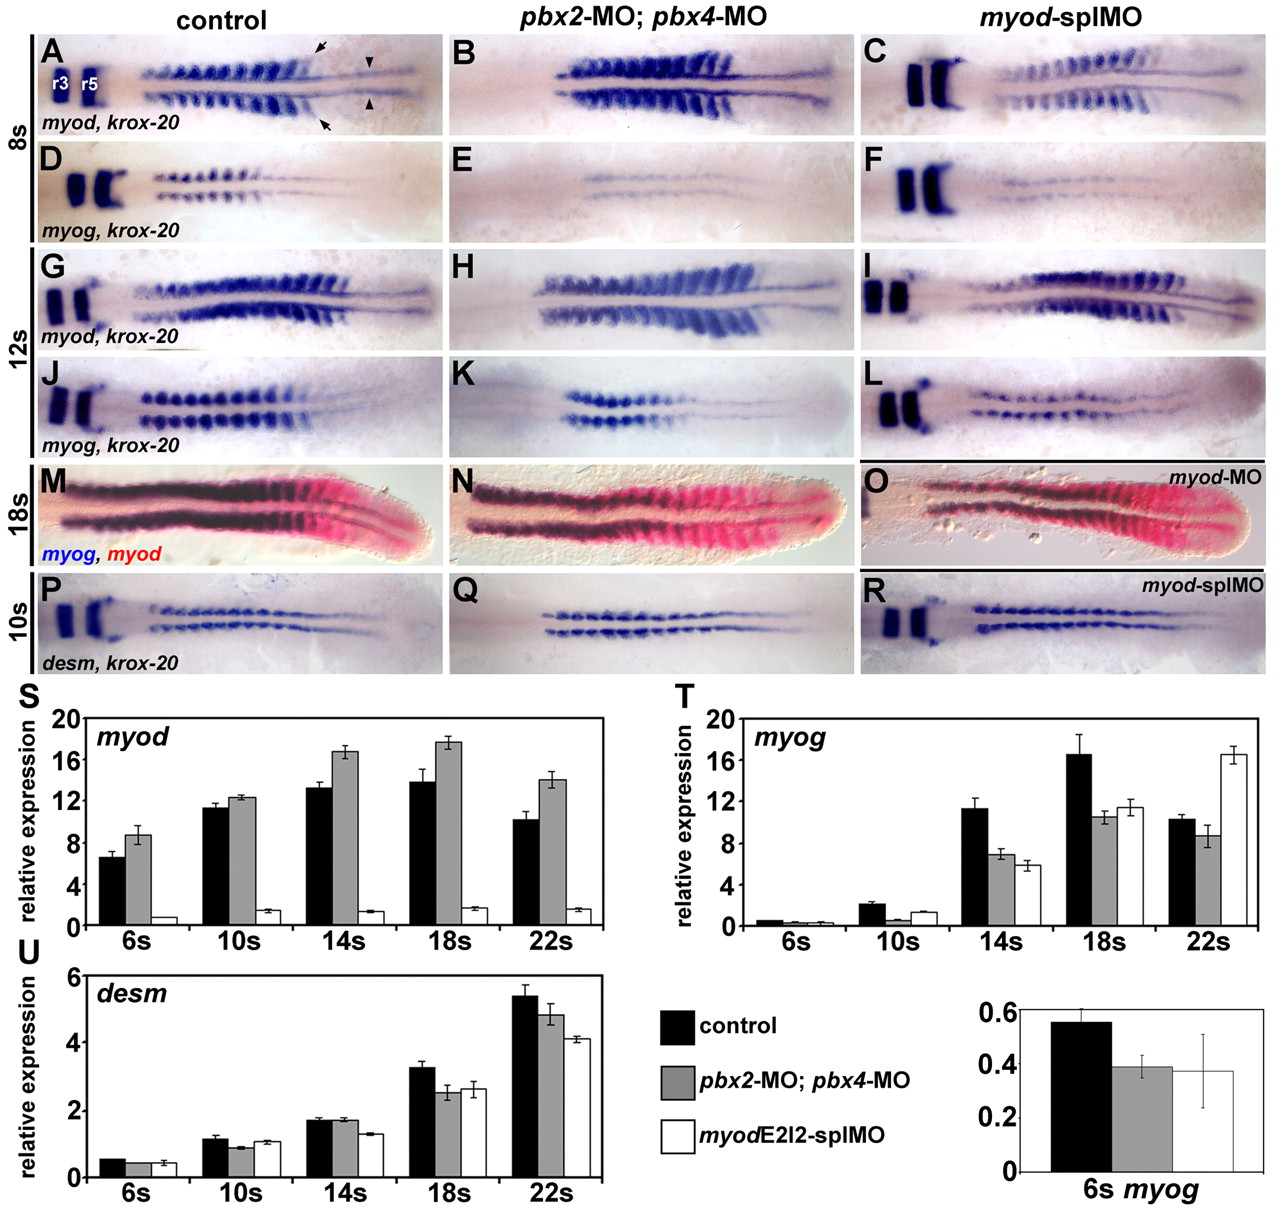
Fig. 1 Pbx and Myod are required for the proper initiation of myog expression. (A-R) RNA in situ expression of (A-C,G-I) myod and krox-20, (D-F,J-L) myog and krox-20, (M-O) myog (blue) and myod (red), or (P-R) desm and krox-20 in (A,D,G,J,M,P) wild-type control, (B,E,H,K,N,Q) pbx2-MO; pbx4-MO, (C,F,I,L,R) myod-splMO, or (O) myod-MO embryos. Similar phenotypes were observed for both myod splice-blocking MOs (myod-splMOs). Somite (s) staging was confirmed by counting somites using Nomarski optics. All embryos are shown in dorsal view, anterior towards the left. (A) Arrowheads point to adaxial cells; arrows point to lateral somite cells; and r3 and r5 indicate krox-20 expression in hindbrain rhombomeres. (S-U) Graphs of real-time reverse-transcriptase (RT)-PCR quantities for (S) myod, (T) myog and (U) desm. (T, bottom) Enlarged view of 6s stage myog expression and the key for S-U. x-axes are developmental stage and y-axes are relative mRNA expression level. Quantities were normalized to odc1 expression. Error bars represent standard deviation. myodE2I2-splMO targets the exon 2-intron 2 boundary (see Fig. S3 in the supplementary material). The myod real-time primers measure only mRNA with properly spliced intron 2. Quantitative (q)RT-PCR shows that less than about 10-15% of normally spliced myod transcripts remain in myod-splMO embryos (Fig. 1S and see Fig. S3 in the supplementary material; and data not shown). Similar quantities for myog and desmin were observed for both myod-splMOs.
Image
Figure Caption
Figure Data
Acknowledgments
This image is the copyrighted work of the attributed author or publisher, and
ZFIN has permission only to display this image to its users.
Additional permissions should be obtained from the applicable author or publisher of the image.
Full text @ Development

