
Image
|
Figure Caption
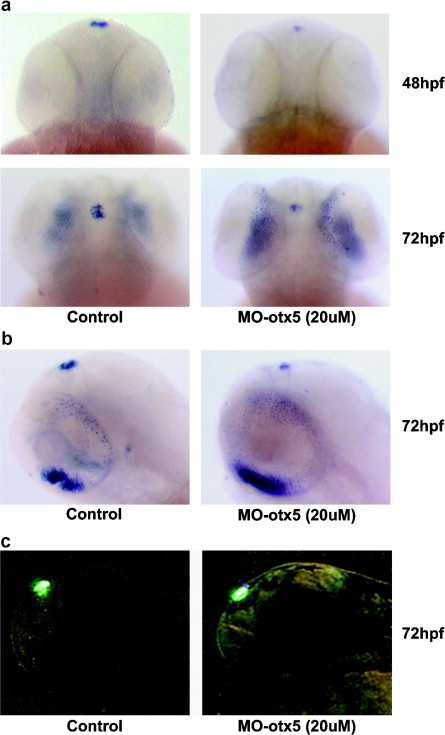
Fig. 7 Regulation of the zebrafish gngT1 expression by otx5 in the pineal gland. The embryos were injected with MO-otx5 and the transcripts were detected by Dig labeled gngT1 probe. (a) Dorsal view of gngT1 expression in the pineal gland. (b) Lateral view of gngT1 expression in the pineal and the retina at 72 hpf. (c) Expression of the GFP in the pineal gland at 72 hpf using the transgenic zebrafish line TG[aanat-2:GFP].
Figure Data
Acknowledgments
This image is the copyrighted work of the attributed author or publisher, and
ZFIN has permission only to display this image to its users.
Additional permissions should be obtained from the applicable author or publisher of the image.
Reprinted from Gene expression patterns : GEP, 7(5), Chen, H., Leung, T., Giger, K.E., Stauffer, A.M., Humbert, J.E., Sinha, S., Horstick, E.J., Hansen, C.A., and Robishaw, J.D., Expression of the G protein gammaT1 subunit during zebrafish development, 574-583, Copyright (2007) with permission from Elsevier. Full text @ Gene Expr. Patterns