
Image
|
Figure Caption
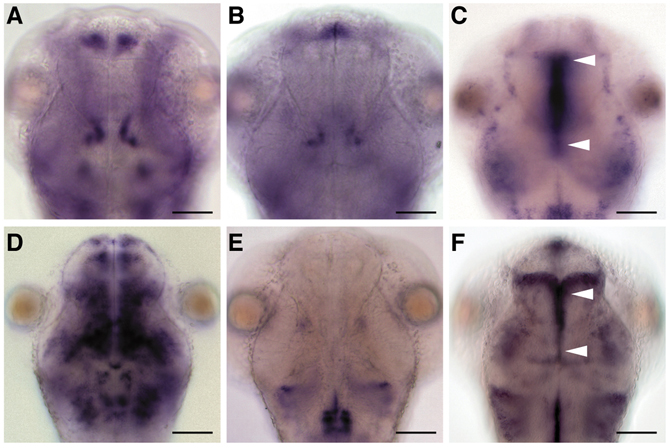
Fig. S1 Expression patterns of semaphorin-related genes in the larval brain. Dorsal views at 2 days of (A) sema3Aa, (B) sema3Ab, (C) sema3D, (D) sema3Fa, (E) sema3Ga and (F) sema3Gb expression. Arrowheads indicate expression in the vicinity of the FR tracts from the diencephalon to the midbrain. Scale bars: 50 μm.
Acknowledgments
This image is the copyrighted work of the attributed author or publisher, and
ZFIN has permission only to display this image to its users.
Additional permissions should be obtained from the applicable author or publisher of the image.
Full text @ Development