
|
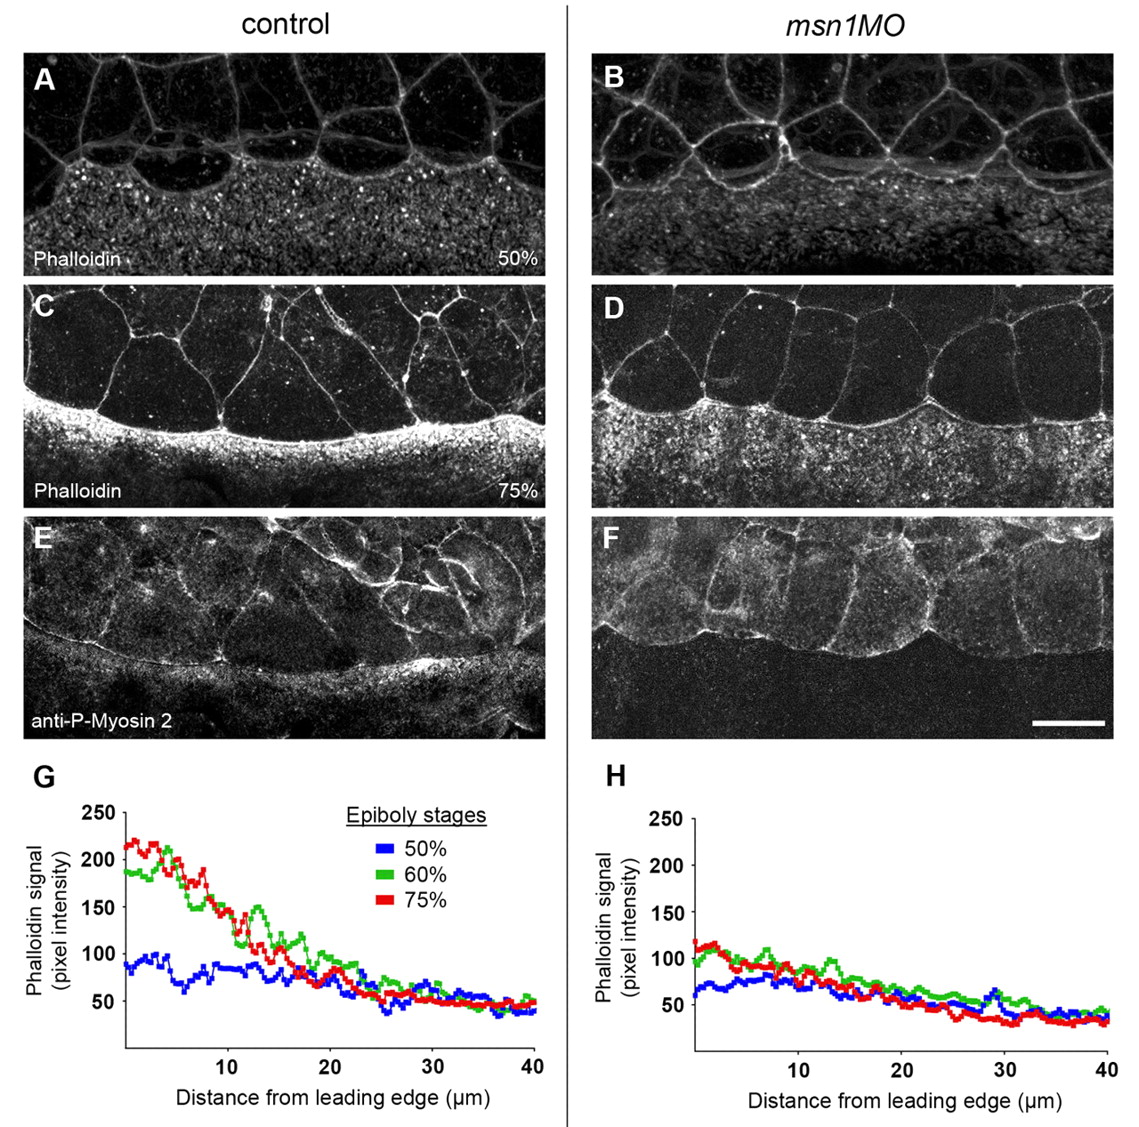
Fig. 4 Cell-shape changes of the EVL during epiboly correlate with msn1-mediated recruitment of actin and myosin 2 in the YSL. (A-F) Analysis of actin and myosin 2 localization in control and YSL-morphant embryos. Phalloidin staining of embryos at 50% epiboly (A,B) and co-staining of 75% epiboly embryos with Phalloidin and an anti-phospho-myosin light chain 2 antibody (C-F). (G,H) Intensity profiles of Phalloidin in the YSL in the vicinity of the EVL margin in control (G) and YSL-morphant embryos (H) at 50%, 60%, and 75% epiboly stages. The intensity of the Phalloidin signal was plotted along a line perpendicular to the EVL margin (see Materials and methods). Average plots are shown. Scale bar in F: 25 μm for A-F.