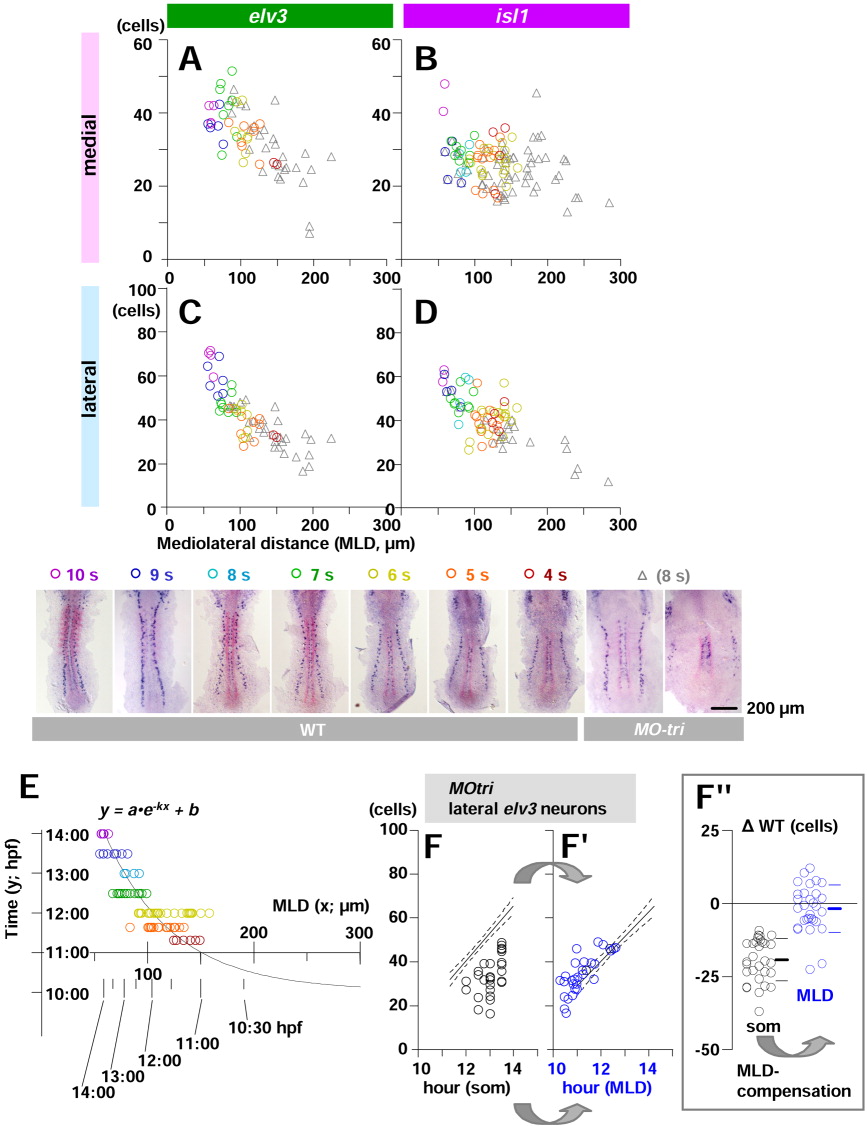
Fig. 4 Mediolateral distance (MLD) is a reliable clock for the neural keel. Establishment of neuronal commitment (neuronal determination) is marked by elv3 and the subsequent onset of neuronal differentiation by isl1. A-D: The number of either elv3-positive (left) or isl1-positive (right) cells per side is plotted as a function of MLD of each embryo. Cell count in the medial (upper) and lateral (lower) proneural domains are separately shown. Color codes reflect the absolute developmental age of embryos estimated from the number of somite, as shown at the bottom. As the embryos get older and have more elv3 and isl1 cells, MLD becomes narrower in both medial and lateral proneural domains. Although MO-tri embryos are in the 8-somite stage, the number of neurons is fewer than those normally expected from uninjected controls with the same somite number. Plots from MO-tri embryos (gray triangles) appear to fit well into the regression line toward younger region of uninjected controls. E: A nomograph is presented for MLD compensation that converts MLD values into the time in hours postfertilization (hpf) specific to the development of neuroectoderm during the neural keel stages (4- to 10-somite stages in wild-type [WT]). The X-axis shows average MLD value of each embryos in length (μm), and the Y-axis shows the absolute age of embryos estimated from the number of the somite in time (hpf). We applied a one-phase exponential decay model with a fixed plateau of the curve (b in the formula in E) at 10 hpf as a time of establishment of the neural plate. The span of y (a in the formula in E; time range for neurogenesis) was fixed to 10 hr based on the observation with RB neurogenesis shown in Figure 3B. The best fit value (r2 = 0.6116) was obtained when a rate constant (k in the formula in E) is 0.01553 (n = 88). F,F": In MO-tri embryos, lateral neuronal commitment (elv3 expression) is indistinguishable from WT when scaled in MLD time (F"); in contrast, the case in somite time (F). The regression lines (solid line) with 95% confidence intervals (region in between two dotted lines) are calculated from results with uninjected wild-type and plotted as a reference in both. F": Each cell count data from F and F' was subtracted with the mean calculated from uninjected WT controls at the identical stage estimated by either somite number or MLD, respectively, and expressed as the difference from uninjected controls ({delta}WT).
Image
Figure Caption
Acknowledgments
This image is the copyrighted work of the attributed author or publisher, and
ZFIN has permission only to display this image to its users.
Additional permissions should be obtained from the applicable author or publisher of the image.
Full text @ Dev. Dyn.

