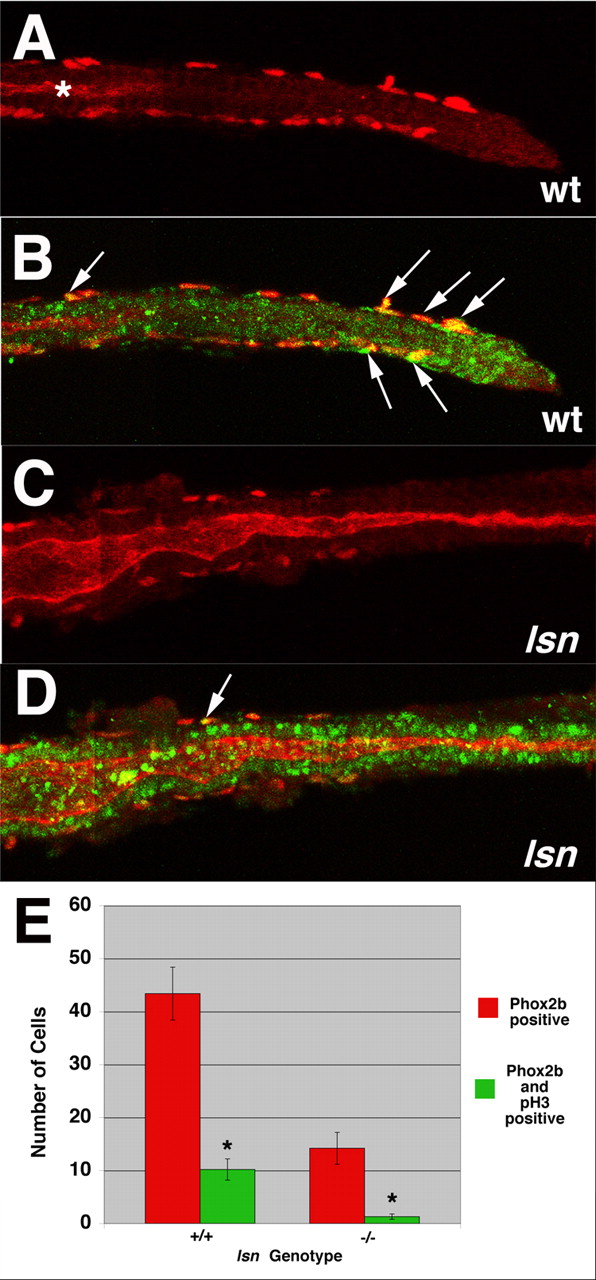
Fig. 8 lsn mutants have reduced ENS precursor proliferation. (A-D) Confocal images of dissected intestines from 48 hpf wild-type (A,B) and lsn (C,D) embryos immunocytochemically stained with anti-Phox2b antibody (red) and anti-phosphohistoneH3 antibody (green). (A,C) Anti-Phox2b immunoreactivity in wild type (A) and lsn (C), showing the most posterior point along the gut tube that Phox2b-positive cells can be identified. (B,D) Merged images of the intestines in A and C showing anti-Phox2b and anti-phosphohistone H3 immunoreactivity (arrows). Asterisk in A indicates the end of the gut lumen, which is not opened up to the distal end of the gut tube at this developmental age. Arrows in B,D indicate double-labelled cells. (E) Bar graph showing the mean number of Phox2b immunoreactive cells (red) and double-labelled Phox2b/phosphohistone H3 positive cells (green) present along the entire length of the intestine of 48 hpf wild-type and homozygous mutant lsn embryos. Embryos derived from an incross of heterozygote lsn fish were fixed and stained with anti-Phox2b and anti-phosphohistone H3 antibodies at 96 hpf and genotyped. Numbers represent the mean number of immunopositive cells±s.e.m. for 10 embryos of each genotype. The difference between them was statistically significant (Student's t-test, *P<0.001).
Image
Figure Caption
Figure Data
Acknowledgments
This image is the copyrighted work of the attributed author or publisher, and
ZFIN has permission only to display this image to its users.
Additional permissions should be obtained from the applicable author or publisher of the image.
Full text @ Development

