
|
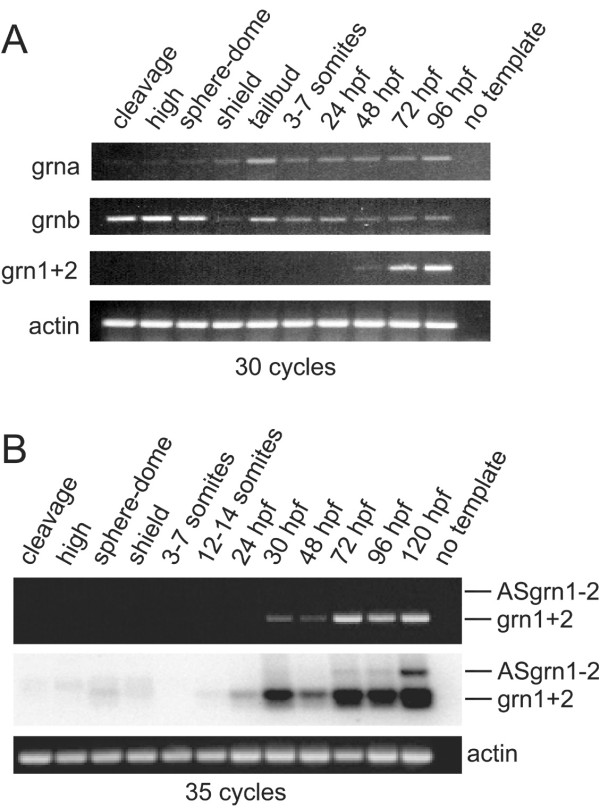
Fig. 7 RT-PCR analysis of zebrafish grn expression during development. Panel A: grna and grnb transcripts are detected throughout all stages of development, whereas grn1 and grn2 expression is first detected by 48 hours post-fertilization. Maternal expression of grnb is more abundant than grna. Panel B: Combined expression of grn1 and grn2 relative to their antisense transcript. Ethidium bromide stain reveals the presence of sense transcription only (top). Detection of the antisense transcript is revealed by using a 32P-labelled oligo as probe that recognizes both sense and antisense amplicons after Southern transfer. Note weak expression of grn1 and/or grn2 at earlier stages of development. Numbers of cycles used for the PCR are indicated. No template and actin were used as negative and positive controls, respectively. Developmental stages are as follows according to Kimmel et al. 1995: cleavage (16-cell); high (mid-blastula, 3 hpf); sphere-dome (late blastula, 4-4.3 hpf); shield (50% epiboly, 6 hpf); tailbud (10 hpf); 3-7 somites (11-12 hpf); 12-14 somites (14-16 hpf); early (24 hpf) and late (48 hpf) pharyngula; hatching (72 hpf); ealy larval period (96 and 120 hpf). Gene specific primers and amplicon sizes are listed in Additional File 10.